


The Daily Struggle of Identity and Security Teams
Every morning, identity and security teams log in with good intentions: reduce identity risk, stay audit-ready, and prove controls are working.
The data is there, scattered across access logs, review records, user lifecycle events, and application inventories. Behind this data lies a bigger challenge: identity footprints are exploding. Employees, contractors, partners, and service accounts now generate millions of access data points across SaaS and AI apps. Compliance requirements only add to the pressure, as SOC 2, ISO 27001, and HIPAA audits demand proof that every access path has been reviewed.
But as the dashboards load, something feels off.
There’s no single place that tells them what actually matters right now. No clear signal of where risk is building. No obvious answer to what should be fixed first.
So decisions stall. Not because teams lack data, but because clarity and direction on what to do next are missing.
Why Having Data Isn’t Enough
In theory, the numbers should help.
In practice, they don’t.
Identity leaders find themselves asking the same questions over and over:
- Which applications are actually failing governance controls?
- Where is our highest access risk today?
- Are orphaned and dormant accounts increasing or just shifting around?
Instead of answers, they get work. Hours spent exporting data. Reports stitched together across systems. Spreadsheets passed around, already outdated by the time they’re shared.
You hear it in every conversation:
- “We spend more time building reports than fixing issues.”
- “We can’t quickly say how many orphaned accounts we have.”
- “We don’t know where to automate or optimize next.”
The problem isn’t missing data. It’s fragmented visibility.
How Teams Try to Make It Work
To cope, teams turn to whatever tools they can find. But each workaround requires manual effort, takes time, and usually incurs additional costs:
- Spreadsheets and pivot tables need constant manual effort to gather, compile, and update reports. They’re error-prone and static, with no automated updates or interactive visualizations.
- Generic BI tools like Power BI and Tableau create polished charts, but they stop at visualization. When you spot a risk, you have to switch tools to fix it. They also come with steep costs: separate fees for data engineers and per-user licenses.
- Data warehouses are powerful but require heavy lifting. Teams have to build tables and queries from scratch, then maintain custom dashboards and reports as systems evolve. The costs pile up through separate charges for compute and storage, as well as ongoing maintenance from technical teams.
- Custom ETL scripts work until they break. Source systems change, edge cases multiply, and what started as a quick fix becomes an engineering dependency that blocks business users from self-service.
The real problem surfaces when risks finally appear. There’s a gap between spotting a risk and fixing it. Dashboards show the problem, but remediation occurs elsewhere. This decision delay is why most risks linger, and breaches happen.
What If There Was a Better Way
At some point, the question changes.
- What if teams didn’t have to export data just to understand it?
- What if tracking critical IGA KPIs didn’t mean rebuilding dashboards somewhere else?
- What if insight and action lived in the same place?
And that’s where IRIS comes in.
Meet IRIS: Zluri’s Identity Risk Intelligence System
IRIS is Zluri’s native IGA analytics platform, designed for one purpose: to help IT and security teams move from data to decisions to action, without friction or delays.
It works across three connected layers
1. Visibility Layer
Complete visibility through 10+ pre-built and customizable dashboards covering real-world use cases across access requests, access management, certifications, shadow IT/AI, and security risks. Track every critical metric across your organization in one place from day one.
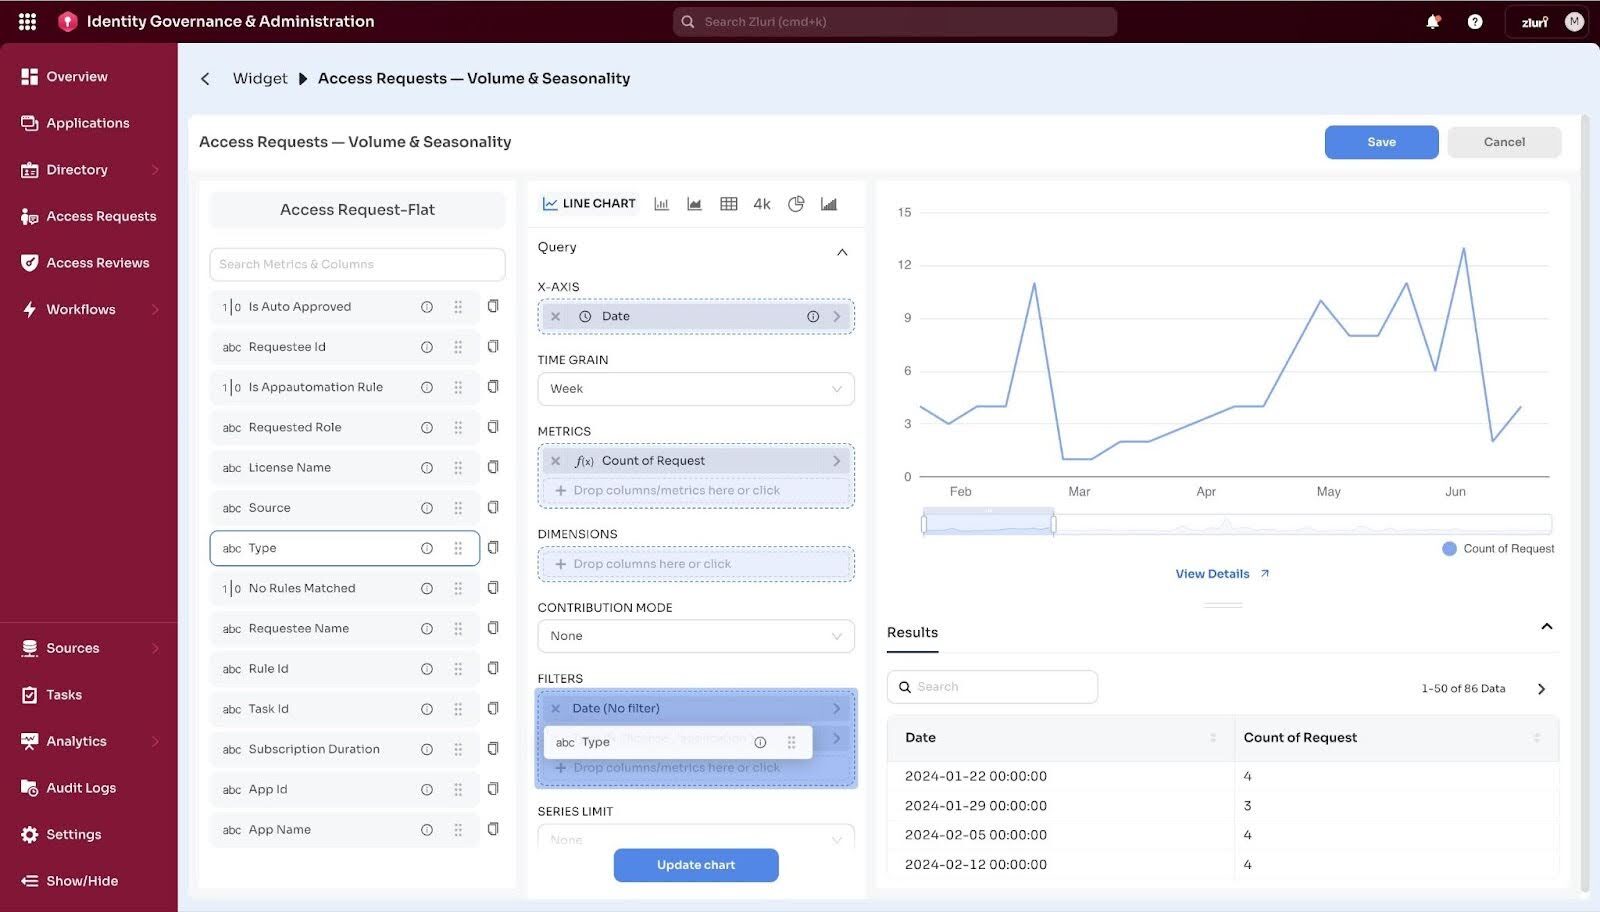
2. Intelligence Layer:
Enterprise-grade, actionable intelligence through 80+ pre-built widgets powered by 8 chart types. These charts tell you what needs attention, why it matters, and where to focus first.
3. Action Layer:
For org-wide dashboards, three types of drill-downs navigate you to exact records: use-case redirects for landing pages, drill-to-details for specific records causing issues, and view-as-table for underlying datasets.
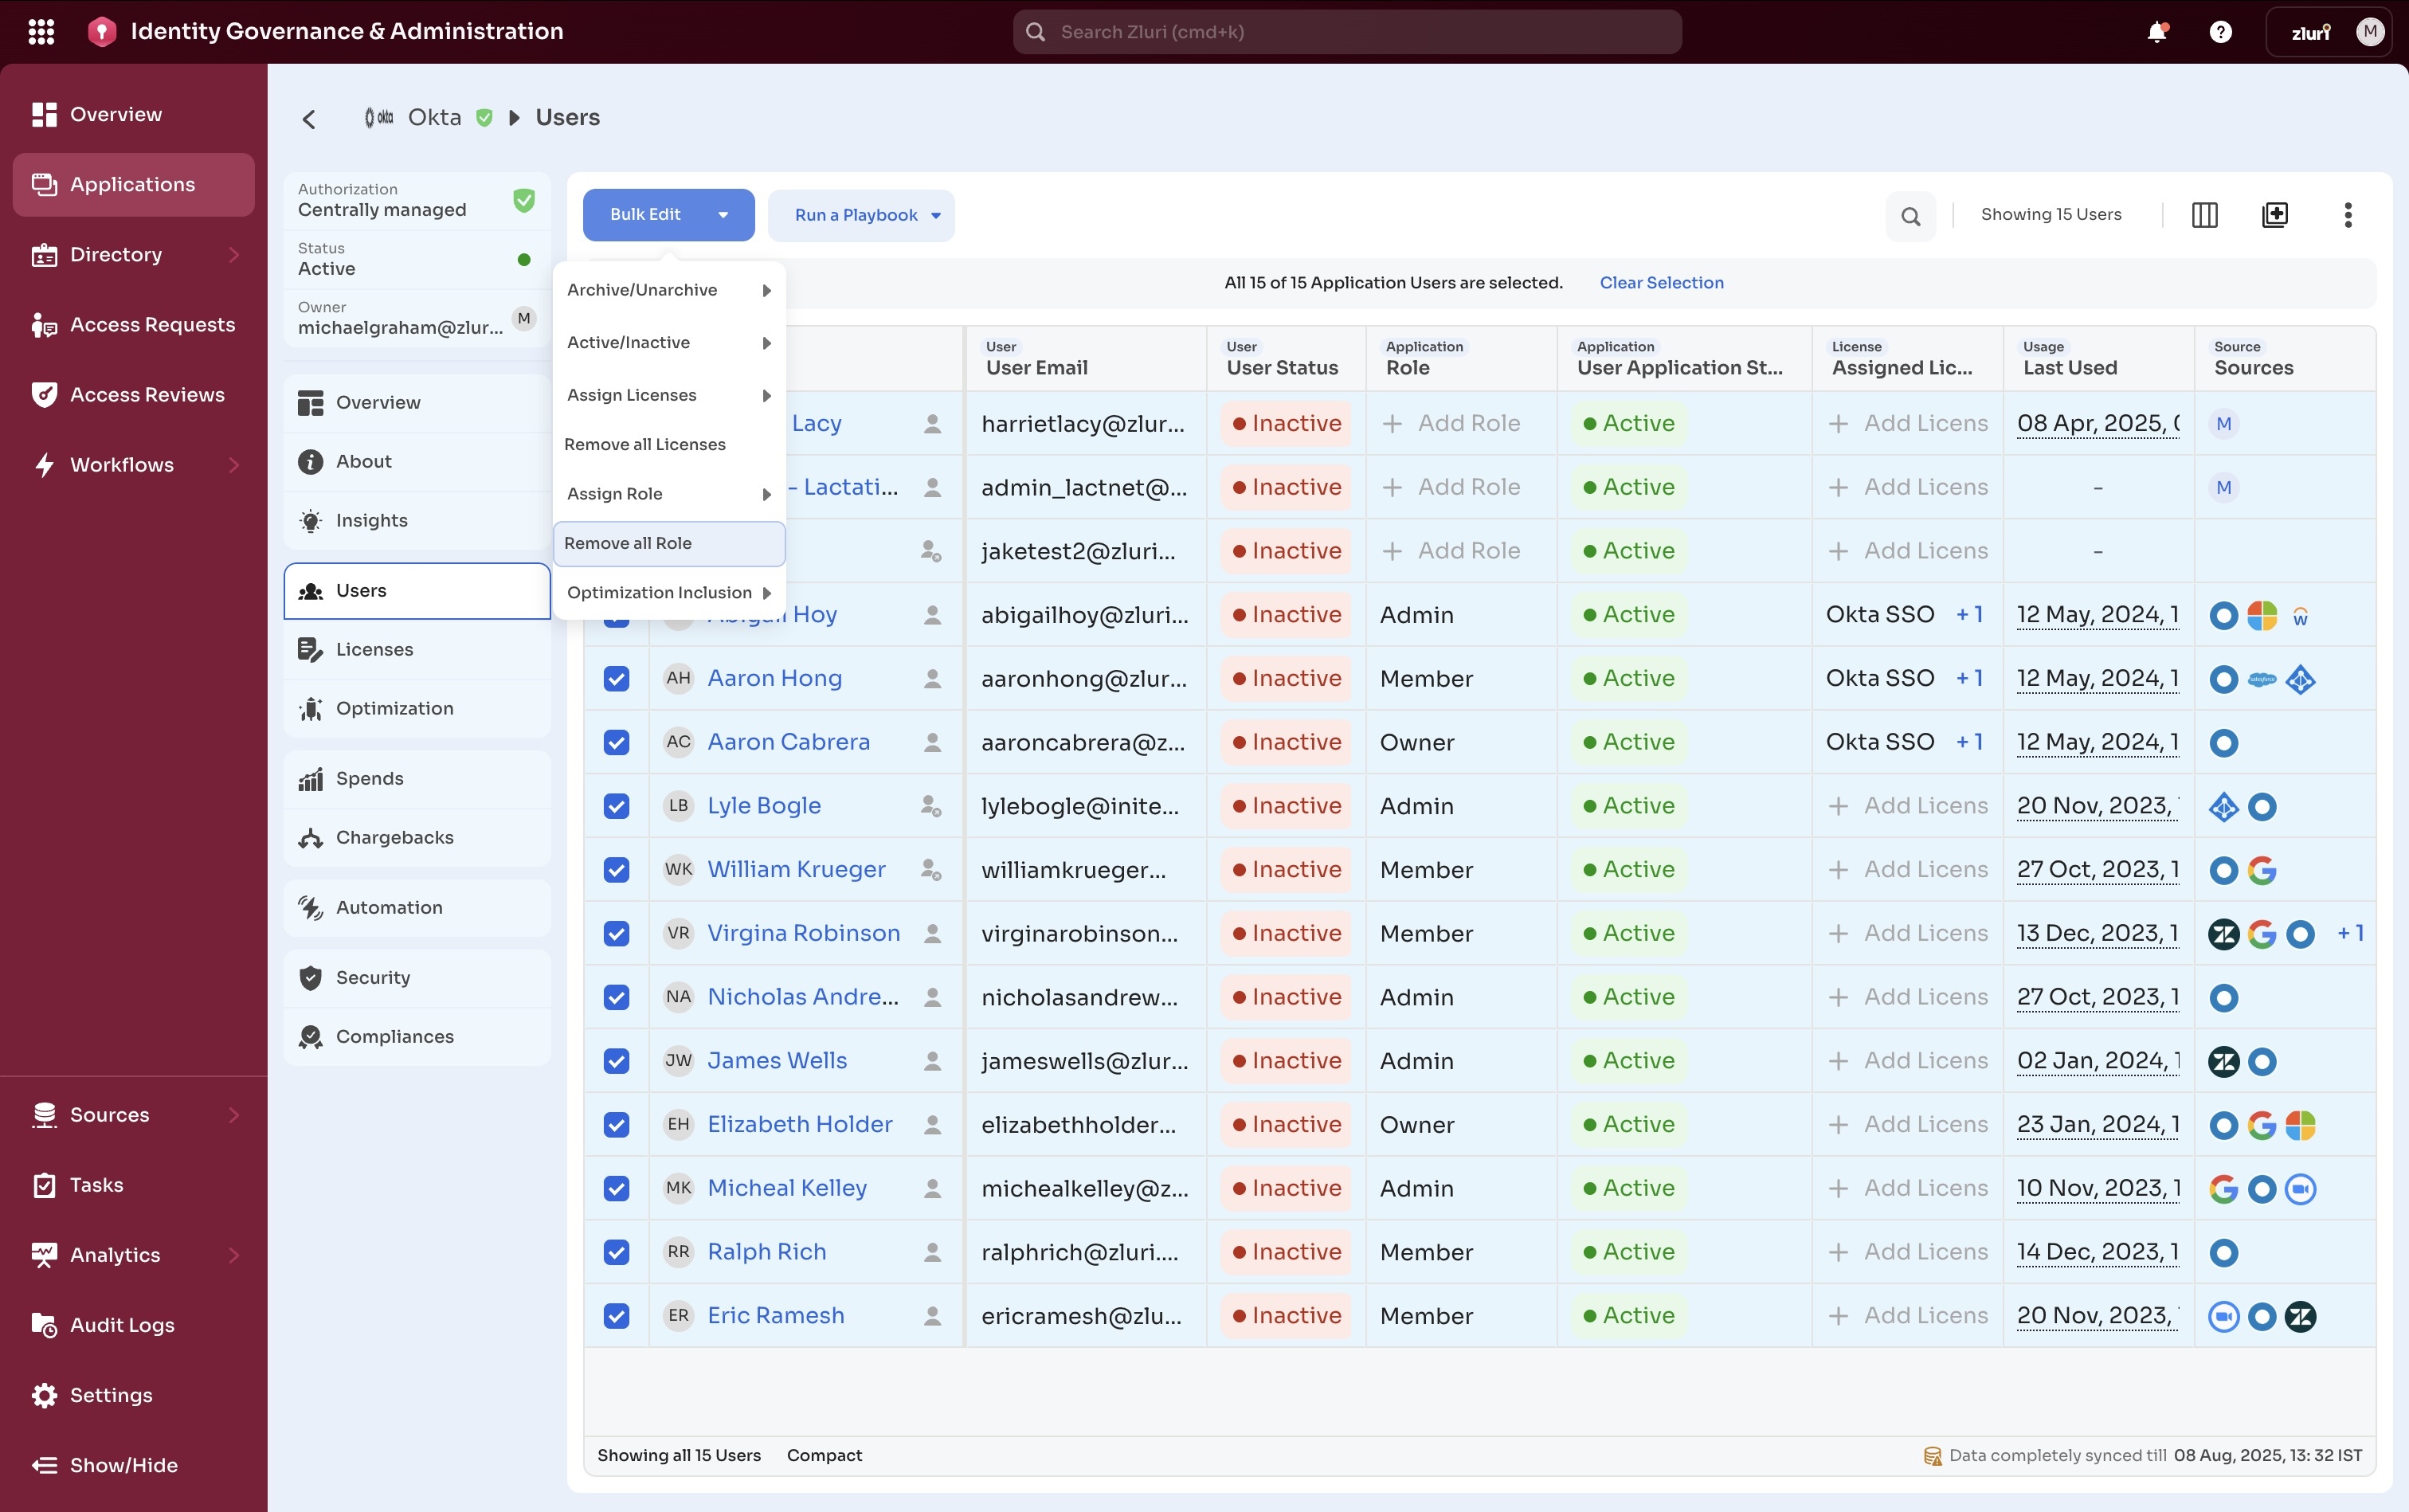
Additionally, you get granular app-level risk visibility through 15+ pre-built and custom insight cards, including but not limited to:
- Security insights that highlight orphaned access, dormant accounts, ignored accounts, service account exposure, and shadow IT users.
- Usage insights show new users detected, stale accounts, users with multiple accounts, and service accounts.
- Optimization insights identify unused licenses, undeprovisioned licenses, and suspended users with licenses.
For high-risk apps, you don’t wait for audits or incidents to force action. You see the risk forming and fix it early by executing bulk remediation workflows.
Watch the video below to see these capabilities in action:
What Makes IRIS Different
IRIS is our native IGA analytics platform that runs on the data Zluri’s patented discovery engine already collects. Data refreshes in real-time, ensuring insights are always up-to-date and actionable.
What truly sets IRIS apart comes down to three things: it speaks your team’s language, it scales with your needs, and it closes the gap between seeing problems and fixing them.
1. Personalized Views for Every Role
Dashboards are tailored to specific roles with role-based access controls, so users see only data relevant to their function.
- Identity/IT Operations Administrators track Access Requests Dashboard (approval bottlenecks, pending fulfillment, fulfilled vs. rejected requests, top apps requested, trends over time), Access Management Dashboard (onboarding/offboarding workflows run, workflow success rates, trends), and Shadow IT Dashboard (restricted app usage, top shadow AI apps by user count).
- IAM, GRC, and Security Teams monitor risks through Security Dashboard (external and orphaned accounts per app, restricted apps in past 30 days, restricted app-wise user counts), Access Reviews Dashboard (ongoing/completed/upcoming certifications, top apps reviewed, access revoked or modified post-review, remediation status), and IGA Main View Dashboard (completed certifications, orphaned and dormant accounts per app, remediation status).
- Application Owners can access dashboards filtered by app to show only their application data, eliminating generic, organization-wide metrics.
- Business Leaders and Executives get board-ready metrics through IGA Main View (managed app count, AI apps in use, total access requests, completed certifications, orphaned/dormant accounts, remediation status, top apps reviewed) and Security Dashboard (external/orphaned accounts per app, restricted app usage, restricted app-wise user count).
2. Flexibility Without Technical Barriers
The drag-and-drop editor lets you place datasets directly on the X and Y axes, apply filters at widget and dashboard levels, and rearrange widgets side-by-side or stacked as needed. Clone existing dashboards with one click for rapid iteration.
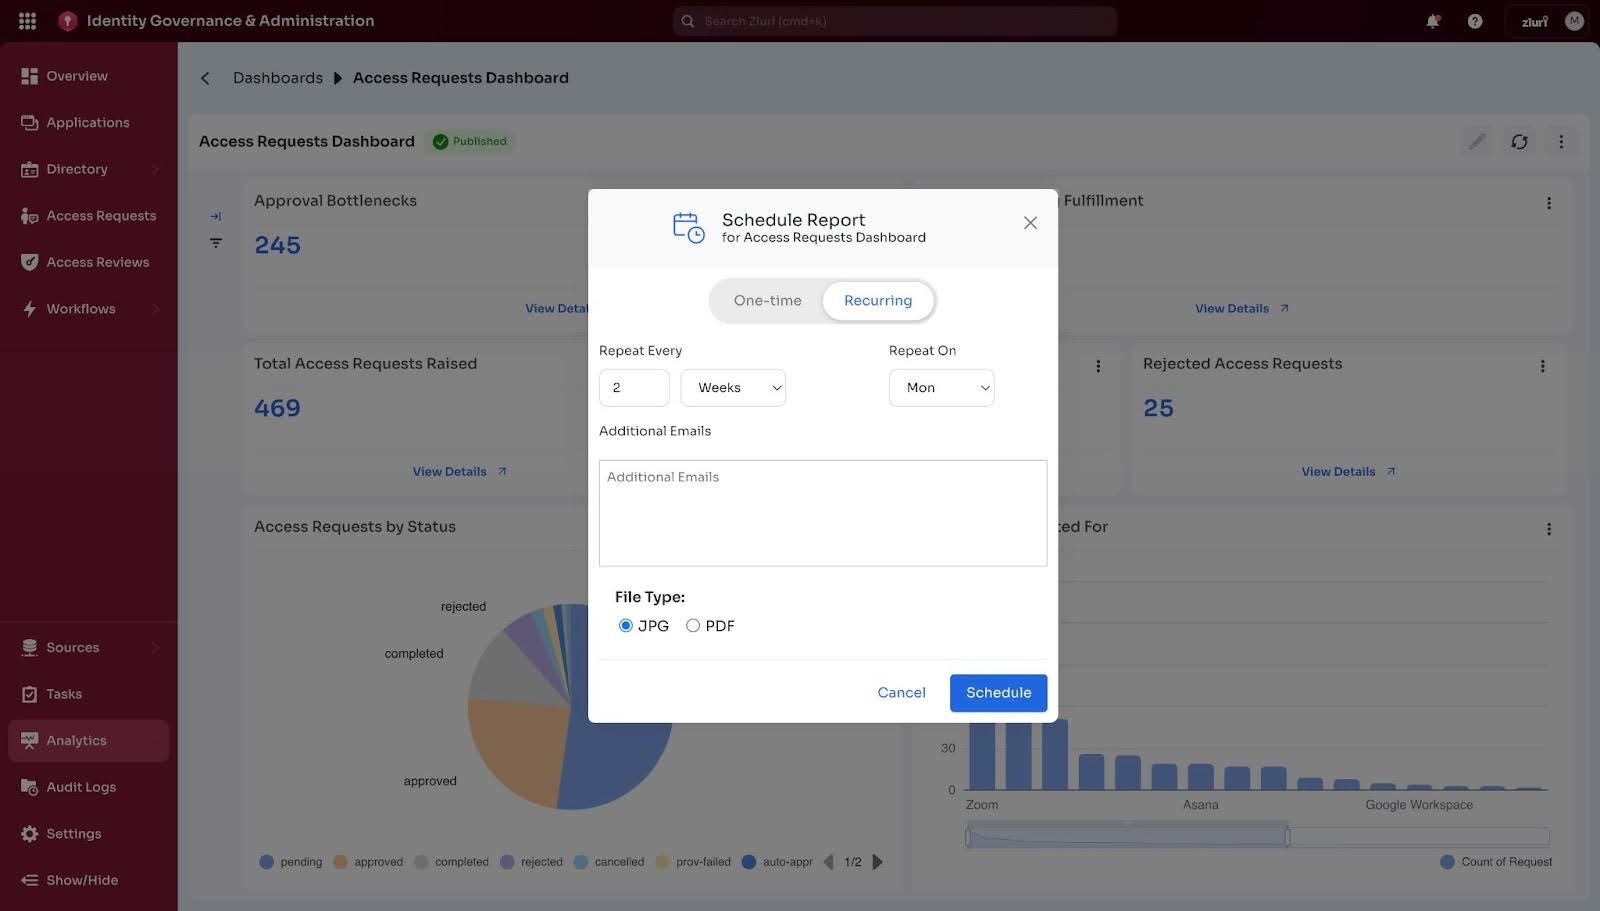
3. Effortless Scheduling and Sharing
Schedule reports once, share them endlessly. Set up one-time or recurring reports that auto-deliver daily, weekly, monthly, yearly, or on custom intervals. Add multiple recipients so auditors, leadership, and teams get insights automatically via email distribution lists. Export entire dashboards as PDF or JPG for compliance, presentations, or offline sharing, or download individual widgets as CSV for detailed analysis.
4. In-Platform Risk Remediation
Most importantly, insight and remediation live together. You don’t just see risk. You resolve it from the same screen.
What Changes with IRIS
With IRIS, the way teams work fundamentally shifts:
- Confidence replaces guesswork: Make decisions based on complete visibility into your real-time identity landscape, not fragmented data from disconnected tools.
- Productivity increases without manual reporting: Eliminate the hours spent preparing reports manually for auditors and the board. Reporting runs on autopilot with scheduled delivery support.
- Vulnerability windows shrink dramatically: The time between risk detection and resolution collapses from weeks to minutes.
- Costs drop down significantly: Eliminate expenses for BI tool licenses, data engineering resources, external consultants, and custom integration maintenance.
- Audit readiness becomes continuous: Generate compliance evidence on demand instead of scrambling for weeks before each audit cycle.
Ready to unlock IRIS's full potential?
Read the help docs on app insights and dashboards for tips and best practices.


.svg)