.png)




One access review produces three very different questions: "Are we at risk?" from your CFO, "Where are the bottlenecks?" from your IT director, and "Prove the control operated" from your auditor. One report can't answer all three. In this guide, we break down the three formats that can.
The Report That Didn't Answer the Question
Your CFO schedules an urgent meeting after your Q3 access review completes.
She opens the email you sent last week containing the review results: a 47-page PDF with detailed tables showing every certification decision for every user across every application. It's comprehensive. It's detailed. It's useless.
She asks: "Did we pass the review?"
You respond: "Yes, the completion rate was 94%."
She looks confused. "I don't know what that means. Did we find anything wrong? Are we at risk?"
You flip through pages looking for the revocation summary. She stops you: "Never mind. Just email me three bullets I can take to the board."
Your 47-page report has none of those bullets.
Later that afternoon, your external auditor emails: "Can you send evidence that Q3 access reviews were completed per SOX requirements? I need the certification decisions with timestamps, proof of remediation, and validation testing."
You forward the same 47-page PDF. He replies: "This doesn't match our testing procedures."
Meanwhile, your IT Director messages: "What was our completion rate by department? I need to know which teams are struggling."
One access review. Three stakeholders. Three completely different needs. One report that satisfies no one.
The solution isn't a better universal report. It's three different reports, each designed for a specific audience with specific questions, all generated from the same review data. In this guide, we cover exactly how to structure each one.
Want the report structures as working documents? Download the UAR report templates (.docx) and populate them after each cycle.
Three Audiences, Three Different Questions
Before the formats, be clear about what each audience actually reads for. This isn't about hiding information; it's about relevance.
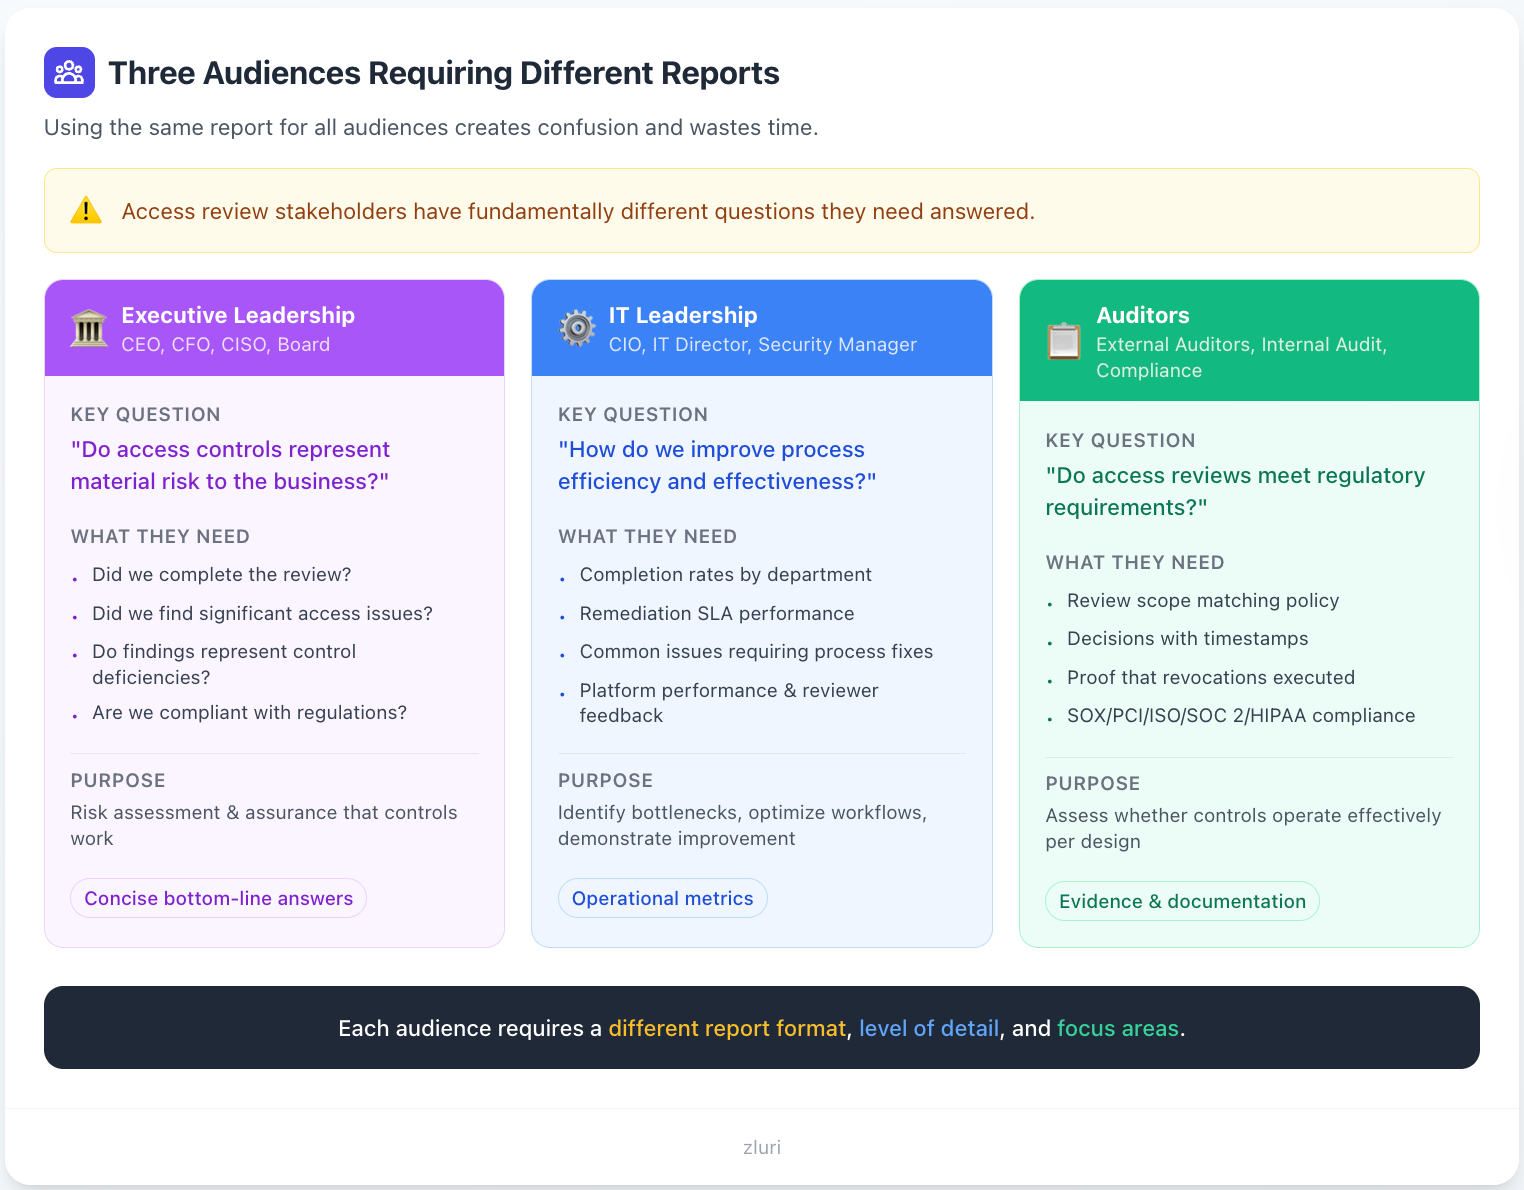
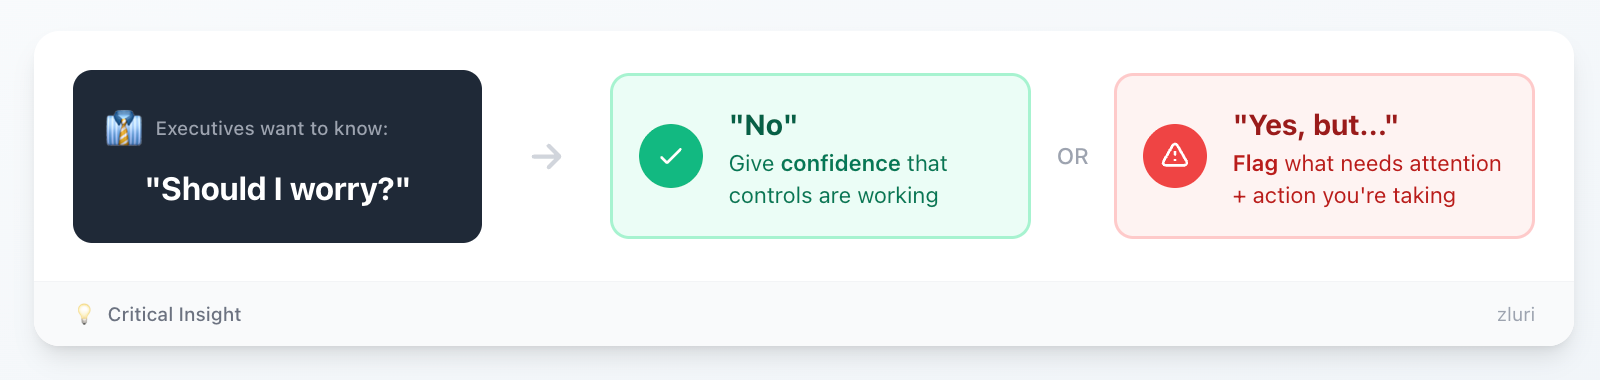
Executives skim. They look at headers, bold text, and status indicators, and they'll give your report two to three minutes unless something looks wrong. Hand a CFO a 47-page PDF and she'll scroll once, close it, and call you for the verbal summary anyway. Your executive report should answer four things in the first 30 seconds: did we complete the review, did we find serious problems, are we compliant, and what are we doing about it.
IT leaders dig into metrics. They compare against last quarter and hunt for patterns. Show an IT director completion rates by department and the first question is "why is that department slower?" They're looking for process problems to fix, not confirmation that the review happened.
Auditors follow testing procedures. They have a checklist of evidence items, and they verify timestamps, completeness, and whether remediation actually executed. They don't want your narrative or your interpretation. If you can't provide evidence systematically, they note a control deficiency, not because the review didn't happen, but because you can't prove it happened the way you claim.
Format 1: The Executive Summary (Actually One Page)
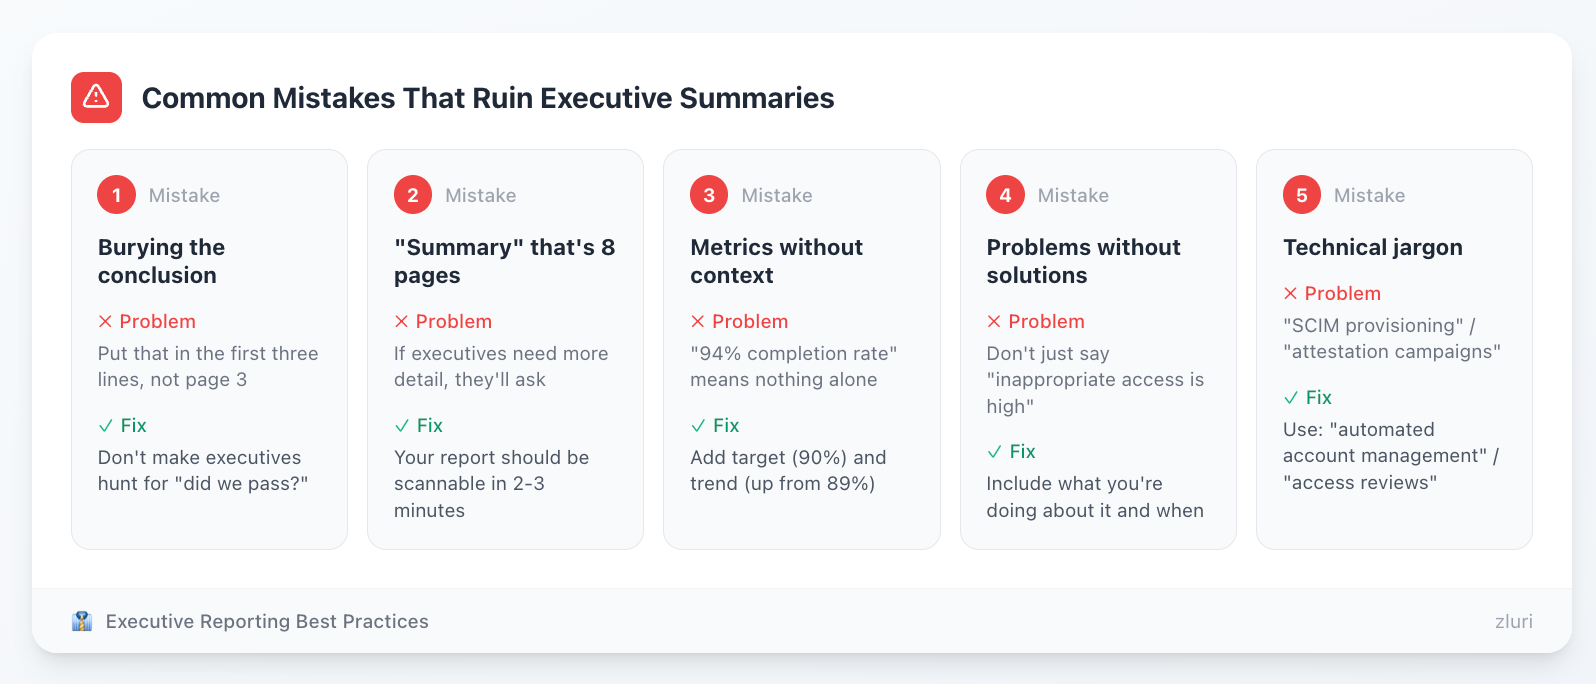
The core principle: lead with answers, not data. Most executive summaries fail because they're compressed technical reports: scope, then methodology, then findings, with the conclusion buried on page three. Executives read in reverse. Conclusion first; supporting evidence only if the conclusion is concerning.
The structure that works, in five short sections:
- Bottom-line assessment (3-4 lines). Completed successfully / issues requiring attention / control deficiency identified, plus completion rate, compliance status, and critical-issue remediation status. Some teams compress this further into a single risk rating ("current access control risk: 4/10, down from 6/10 last quarter"), which boards respond to well.
- Key findings (3-5 bullets maximum). Only findings that matter at executive level: terminated employees still active, segregation-of-duties violations, compliance exposure, trends above benchmark. One sentence each. If a finding needs a paragraph, it belongs in the IT report.
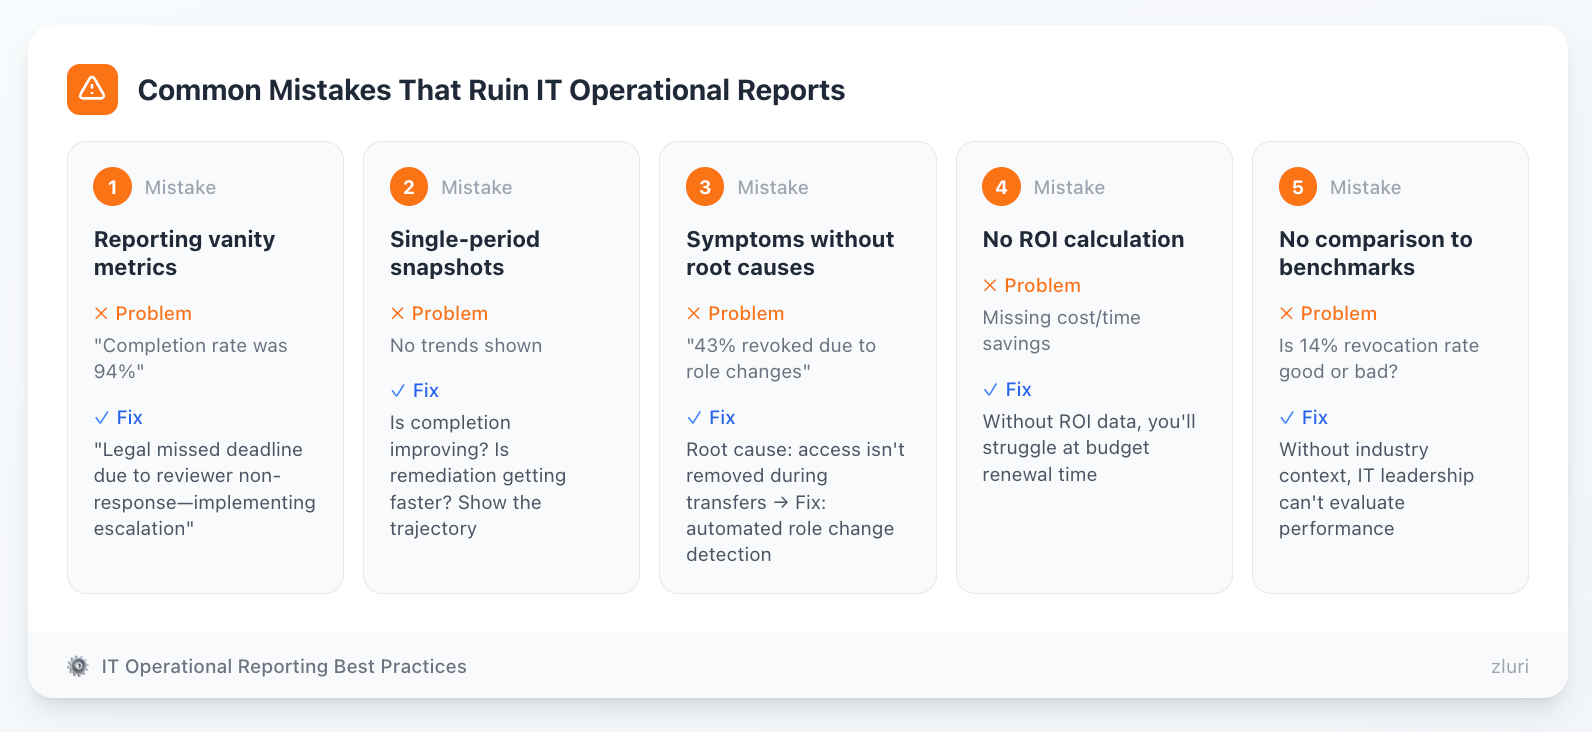
- Performance trend (4-quarter view). Completion rate, revocation rate, and remediation time over four quarters. A single-quarter number means nothing: a 14% revocation rate is an improvement if you were at 22%, and degradation if you were at 8%.
- Recommendations (2-3 maximum). Each with the action, the timeline, and the expected impact, for example implementing role-based access control in 30 days to bring inappropriate access under 10%.
- Risk assessment table. Current state, target state, and action plan for two to three key risk areas, plus resource impact ("3 IT staff-weeks per quarter for remediation"). This is what lets leadership decide: fund the fix or accept the risk.
Everything else gets deliberately excluded: methodology, department breakdowns, application-level analysis, platform metrics, complete findings lists, ROI analysis, individual decisions. All of it lives in the other two reports.
Use this format for: board presentations, CFO/CEO quarterly updates, M&A or investor due diligence, and anywhere the audience needs confidence rather than detail.
Format 2: The IT Operational Report (Metrics That Drive Fixes)
The core principle: surface operational intelligence, not compliance checkboxes. "Completion rate 94%, remediation complete, status green" is a status update, not intelligence. The effective version reveals where the process works, where it breaks, and why.
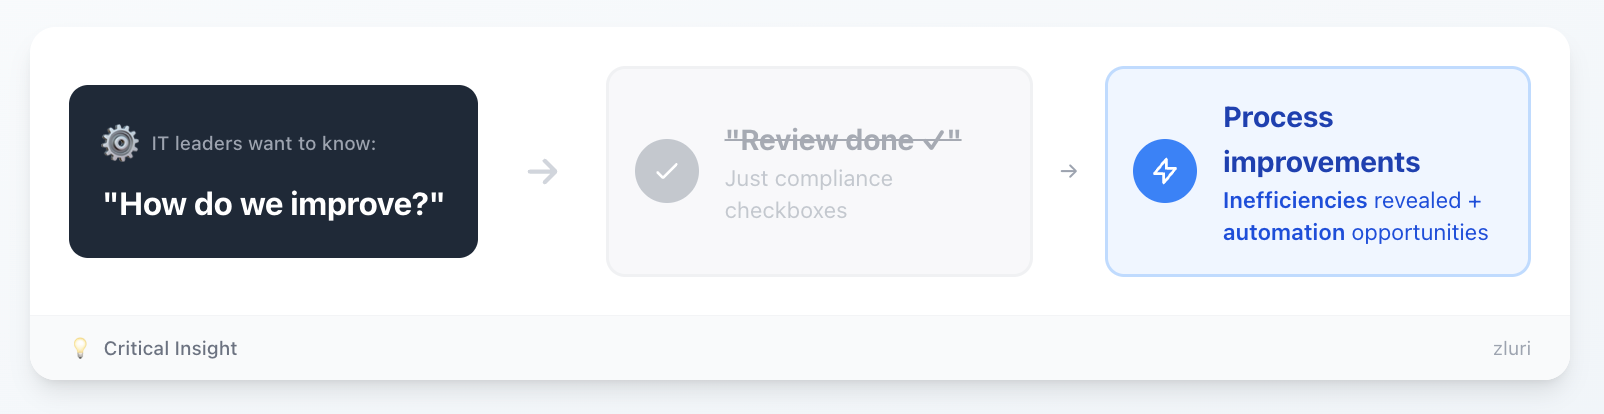
Typically five to eight pages, structured around seven analyses:
Completion performance by department. The overall rate hides the story. Legal at 0% needs an escalation process; executives taking seven-plus days need earlier scheduling; a department finishing in four days has a workflow worth copying.
Decision breakdown with root causes. Don't stop at "85% approved, 14% revoked, 1% modified." Dig into why access was revoked:
- Role changes: access isn't being removed during internal transfers
- Dormant accounts: you need an auto-disable policy
- Project completions: temporary access isn't being tracked or time-bound
Every revocation reason is an upstream provisioning or lifecycle gap wearing a review-finding costume. The real value of this section is identifying those gaps so next quarter has fewer findings.
Application-level analysis. Which apps have the highest revocation rates tells you where governance is weakest. A cloud console at 36% inappropriate access is a provisioning problem: developers getting standing admin instead of temporary elevation. A code repository at 24% is a lifecycle problem: project teams join, projects end, nobody leaves the org.
Privileged access deep dive. Privileged accounts get their own analysis by privilege type. Contractor admin accounts surviving contract end is an offboarding gap; an admin account following someone into a new department is a role-change detection gap.
Remediation performance. This half of the report measures execution, not planning:
- SLA compliance by priority level
- Average remediation time, and the trend against last quarter
- Late remediations with their root cause
- Remediation speed by application type
If a handful of legacy apps account for most late remediations, that's your integration priority list. Execution is where the closed-loop remediation discipline either shows up in the numbers or doesn't.
Cost and ROI. IT leadership has to justify the platform at budget time, so calculate it properly:
- Total time investment in hours, across every role involved
- Labor cost (hours × blended rate)
- Platform cost, and cost per user reviewed
- Savings versus the manual process, quarterly and annualized
"We save 244 hours per quarter versus manual" is the sentence that survives budget season. For context on what manual actually costs, our survey of 215 security and IT leaders found 38% spend five to seven days on every cycle, with manual teams pulling in 21 to 50 people each time.
Recommendations for next quarter. Process improvements, platform changes, training fixes, each with expected outcomes. This section is the reason the report exists: it turns this quarter's findings into next quarter's fewer findings.
Use this format for: IT leadership meetings, process retrospectives, platform ROI justification, and quarterly operational reviews.
Format 3: The Auditor Evidence Package (Systematic Documentation)
The core principle: anticipate testing procedures, don't react to requests. Most teams treat evidence as something gathered after the auditor asks. Effective packages are structured around how auditors actually test controls.
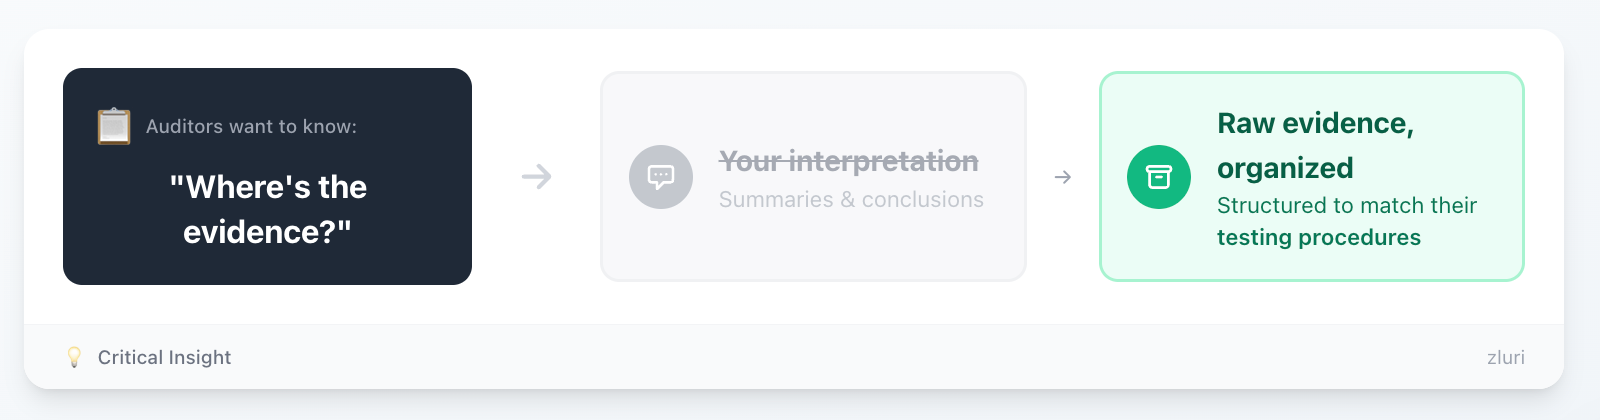
Fifteen to twenty-five pages plus exhibits, in eight sections:
- Control objective. Control ID, description, owner, frequency, and the regulatory requirements it satisfies (SOX 404, PCI DSS 7.1, HIPAA 164.308, SOC 2 CC6.2).
- Review scope. Every application reviewed, its classification (financial, CDE, ePHI, business-critical), user count, and compliance scope. Auditors compare this against your documented policy to verify you reviewed everything you said you would.
- Control design documentation. Policy reference, process steps, roles and responsibilities: proof the control is designed properly before they test execution.
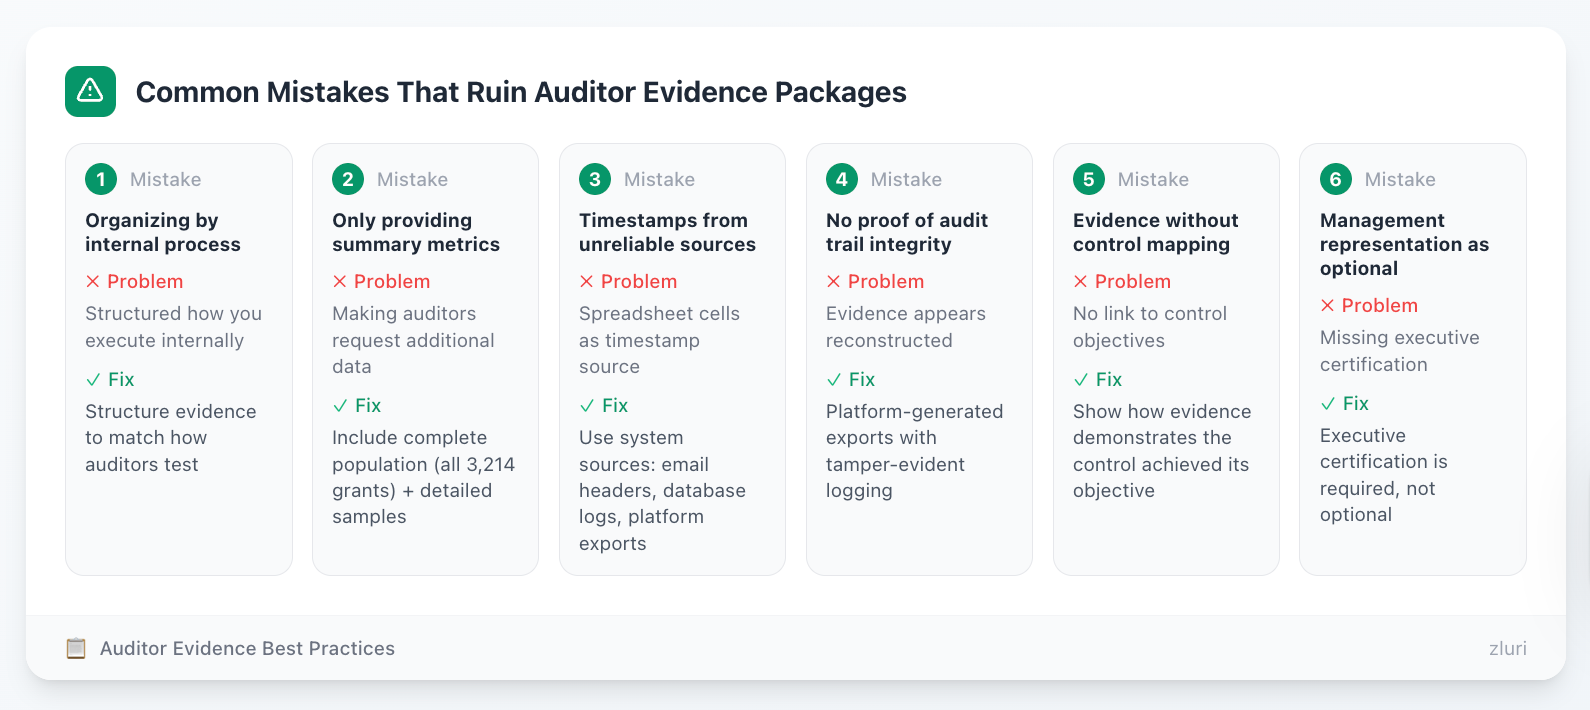
- Operating effectiveness evidence. The heart of the package: launch notifications with delivery confirmation, the complete certification decision log with timestamps and owner IDs, remediation tickets with creation and completion dates, validation testing results (sample size, authentication attempts, access-denied proof), and the full audit trail export.
- Completion metrics by compliance scope. SOX-scoped, PCI-scoped, HIPAA-scoped completion rates broken out separately; compliance-scoped systems at 100% is the finding auditors care about most.
- Control deficiency assessment. Your testing conclusion, design adequacy, operating effectiveness, and the basis for each. Make it easy for the auditor to concur.
- Management representation. CISO and CFO certification that the evidence is complete and accurate.
- Evidence exhibits. Everything attached: emails, screenshots, decision logs, tickets, validation results, audit trail exports, policy documents.
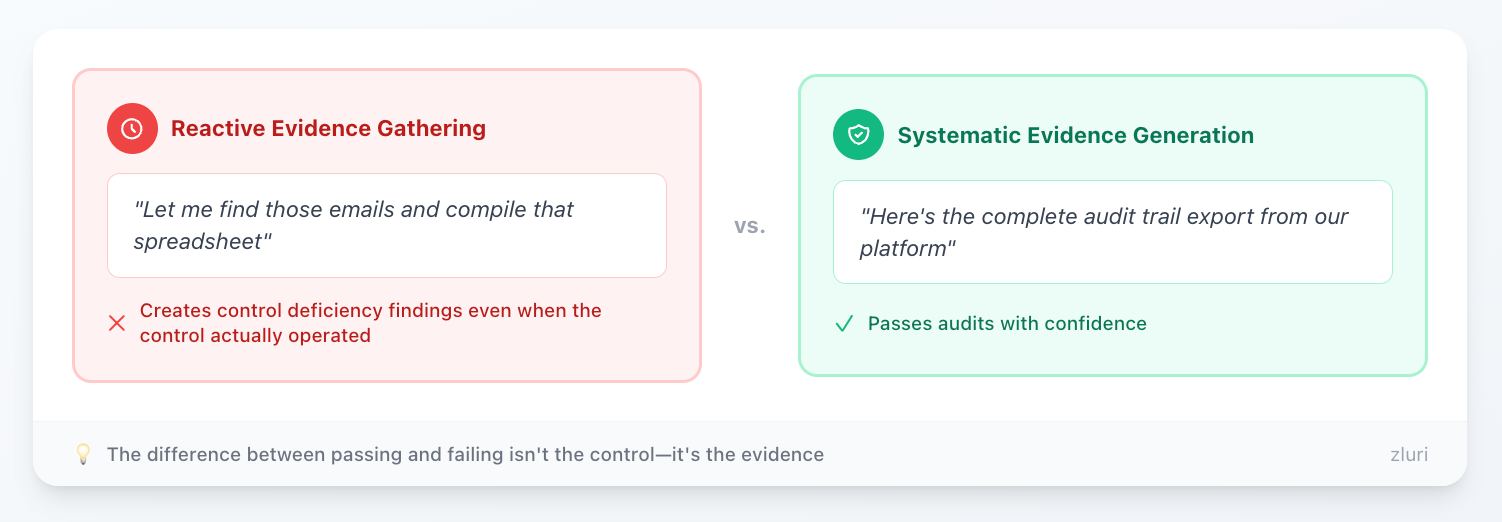
The detail that separates passing from failing: timestamps must come from the platform database, not spreadsheet cells anyone could edit. Tamper-evident evidence, captured as the control operated, is what auditors mean by "systematic." A reconstructed ZIP file of emails and screenshots is real evidence with an unprovable chain of custody, and it draws deficiency findings even when the control genuinely operated.
What auditors test against this package, framework by framework, is covered in our user access review audit guide; the two documents are designed to work as a pair.
Use this format for: external audits, regulatory examinations, internal audit reviews, and pre-audit preparation.
The Scattered Evidence Problem
Here's what happens at most companies when the auditor's email lands: the certification spreadsheet is somewhere in SharePoint, the notification emails are scattered across a sent folder, the remediation tickets need a custom Jira query, the validation confirmations live in a Slack channel, and the screenshots are in someone's Downloads folder.
Six hours of reconstruction later, you send a ZIP file, and the auditor replies: "This evidence exists, but it's not systematically collected. Where's the tamper-evident audit trail?"
The problem is treating audit evidence as something you gather after the fact rather than something generated as the control operates.
When reviews run through a modern governance platform, every decision, remediation, and validation is captured with timestamps as it happens, and the evidence package is an export, not a project.
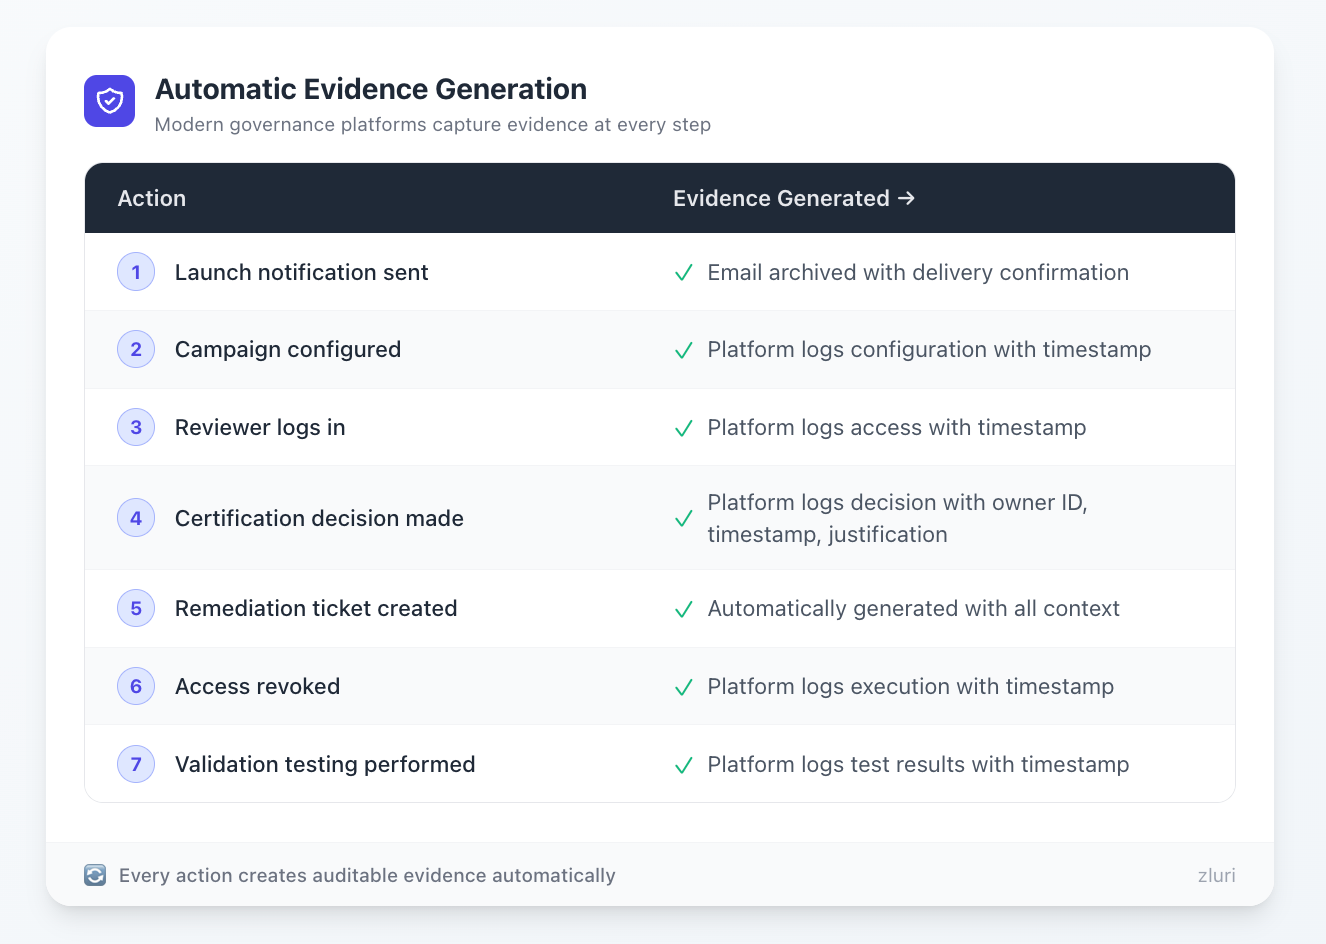
The difference between "let me find those emails" and "here's the complete audit trail" is the difference between a deficiency finding and a clean opinion.
One Review, Three Reports
You don't run three reviews. You run one review and cut the same data three ways:
- Executive summary: top findings, risk score, trend, approval status
- IT operational report: findings filtered by department and application, organized into owned remediation tasks
- Evidence package: the complete population with full context, timestamps, and compliance mappings
Set the templates up once, before the review starts, and generating all three becomes a click instead of a project. Decide who prepares each (typically the security team prepares all three, with the CISO reviewing the executive summary), brief each audience on what they'll receive, and send the executive and IT reports within a week of cycle close while the evidence package gets archived for the next audit request. After two or three cycles, ask each audience what's missing and what they skip, and trim accordingly.
You'll know it's working when executives stop scheduling clarification meetings, IT starts fixing the bottlenecks the metrics expose, and the auditor's response shortens to "this is exactly what we needed."
Two companion pieces complete the loop: the user access review checklist covers the Phase 5 evidence checkpoints that feed these reports, and the user access review procedure shows where report generation sits in the execution cycle. If you're newer to the topic, our complete guide to user access reviews covers the full picture.
Ready to see auto-generated versions of all three? Zluri generates the executive dashboard, operational metrics, and audit-ready evidence package from the same review data, with systematic collection built in. The setup walkthrough is here: How Access Reviews Work in Zluri.
Frequently Asked Questions
Can't I just send the IT operational report to everyone? It has all the information.
No. Executives won't read it: too long, too detailed. Auditors don't want operational metrics: they want systematic evidence organized for testing. Each audience needs the same data formatted for their specific use, and the point isn't hiding information; anyone who asks for the deeper report can have it.
How do we generate three reports without tripling our workload?
Templates plus a platform. You're not writing three reports manually; you're configuring three views that pull from the same review data. Once templates exist, generation is minutes per cycle, and it's less total work than fielding a quarter's worth of questions about one confusing report.
We're a 200-person company. Do we really need three different reports?
If you have executives, an IT team, and auditors, yes. Company size doesn't change what each audience needs; a startup CFO still wants the bottom-line assessment, not operational metrics. What changes with size is length, not format.
Do auditors actually care about this level of documentation?
Yes. Companies receive control deficiency findings not because the review didn't happen, but because they couldn't prove it happened systematically. Auditors verify controls through evidence, not trust, and "we have it somewhere" reads as a gap.
What if our metrics are terrible? Do we still send the executive report?
Yes, framed honestly. If completion was 60%, lead with "review incomplete: 40% missed the deadline" and the action plan. Bad news delivered clearly builds more credibility than bad news hidden on page 31 of 47.