.png)




Most governance programs can't answer "is this working?" without an export-and-reconcile project. Zluri's Governance Intelligence dashboards exist so that question is a glance: six dashboards, each computing its metrics continuously from the same data layer the governance itself runs on.
The hard part of governance measurement was never the arithmetic. It's that every meaningful metric spans systems: an HR event in one tool, a workflow in another, per-app account state in a third. Assembling that chain by hand is the measurement problem in a sentence, and it's why most programs report activity instead of outcomes.
Governance Intelligence is what that problem looks like solved. Because requests, reviews, workflows, and account state already run through one platform, the chain each metric needs already exists as connected data. The dashboards are a window onto it, not a pipeline built on top of it.
The dashboards don't collect the data. The platform's normal operation produces it, and the dashboards read it.
The Six Dashboards, at a Glance
Governance Intelligence is organized into six dashboards, each answering a different governance question:
- Access Governance: who has access to what, right now, across the estate
- Access Reviews & Certifications: are campaigns completing, and what are they finding
- Entitlement & Account Hygiene: what's accumulating that shouldn't be
- Lifecycle Automation: are joiner, mover, and leaver events executing completely
- Application Governance: is every app owned, scoped, and under policy
- Audit & Compliance: can you prove all of the above, on demand
The sections below cover each one: the metrics it carries, and what those numbers actually tell you.
Dashboard 1: Access Governance
The estate-wide view of standing access. Its metrics answer the question every other dashboard depends on: what does access actually look like right now?
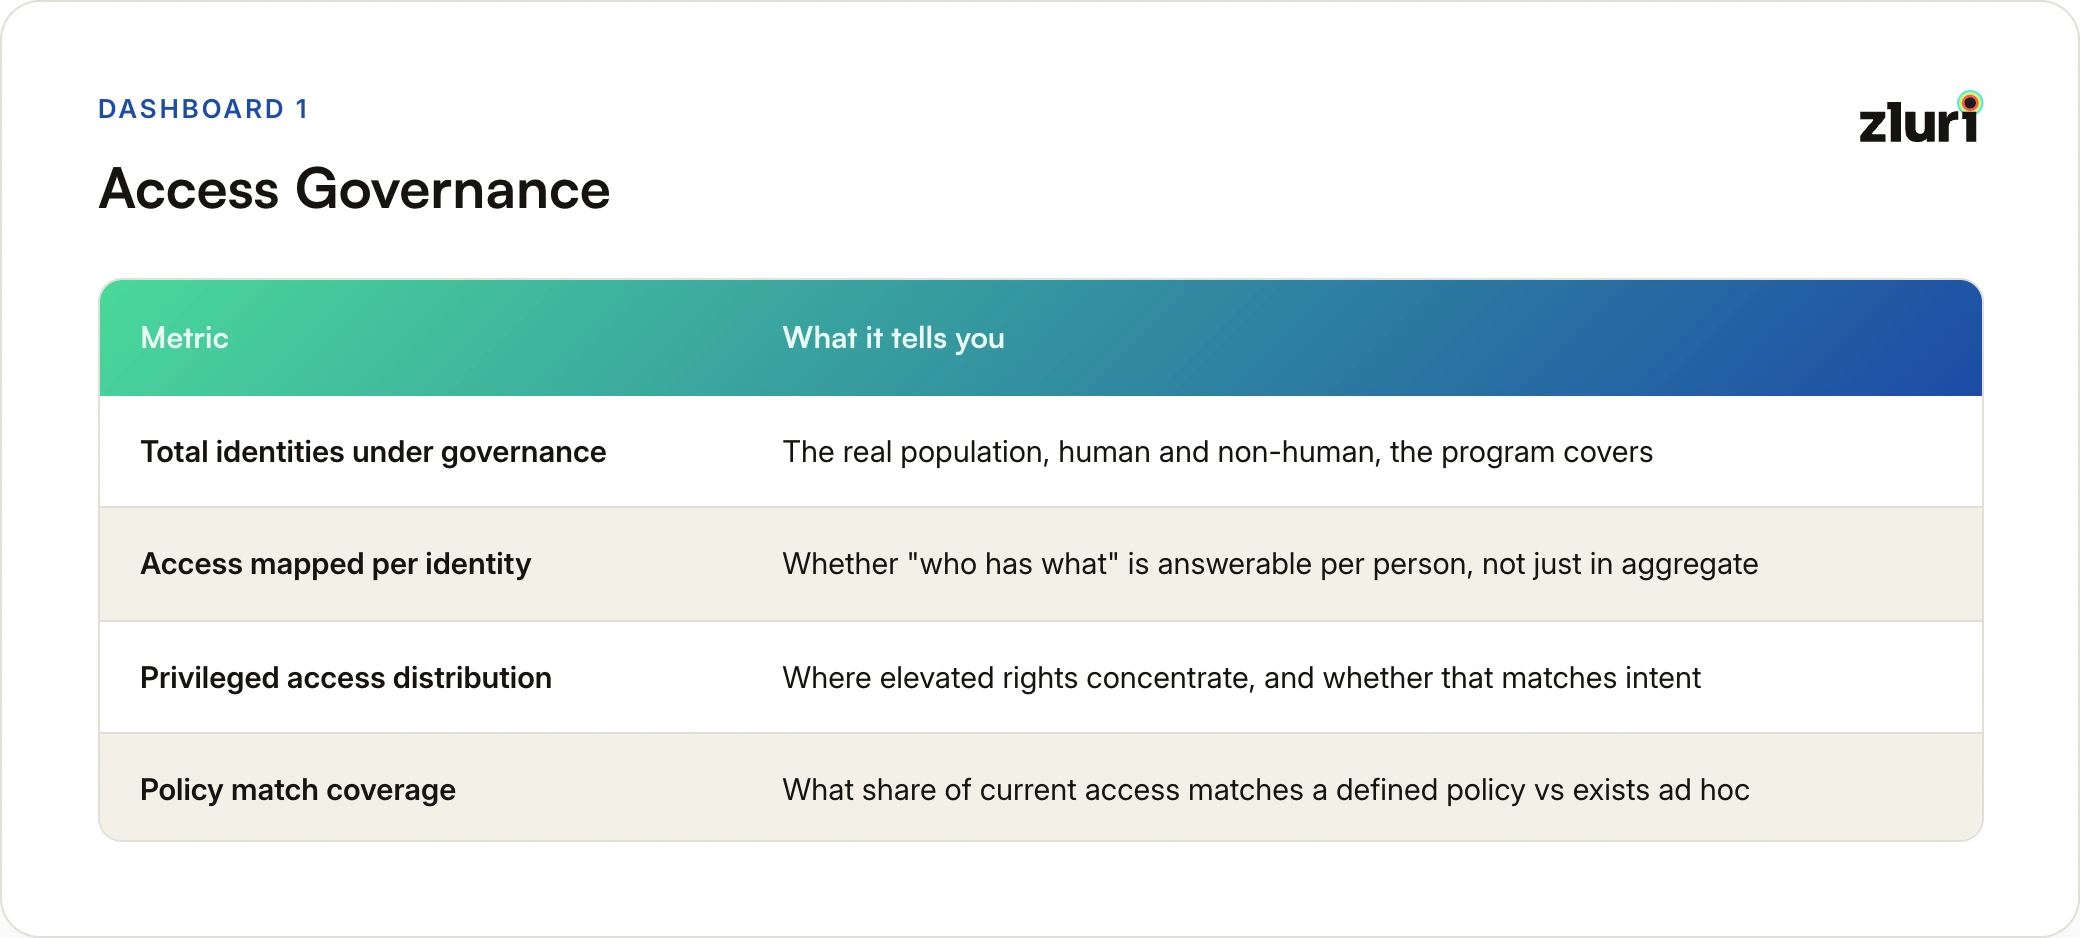
This dashboard tracks the total population of identities under governance (including non-human ones), whether access is fully mapped per identity, where privileged access concentrates across teams and apps, and how much of the current access picture matches defined policy rather than existing ad hoc. Together those four say whether governance is operating on the real estate or a subset of it.
Dashboard 2: Access Reviews & Certifications
The campaign view: whether reviews are running, completing, and actually finding things.
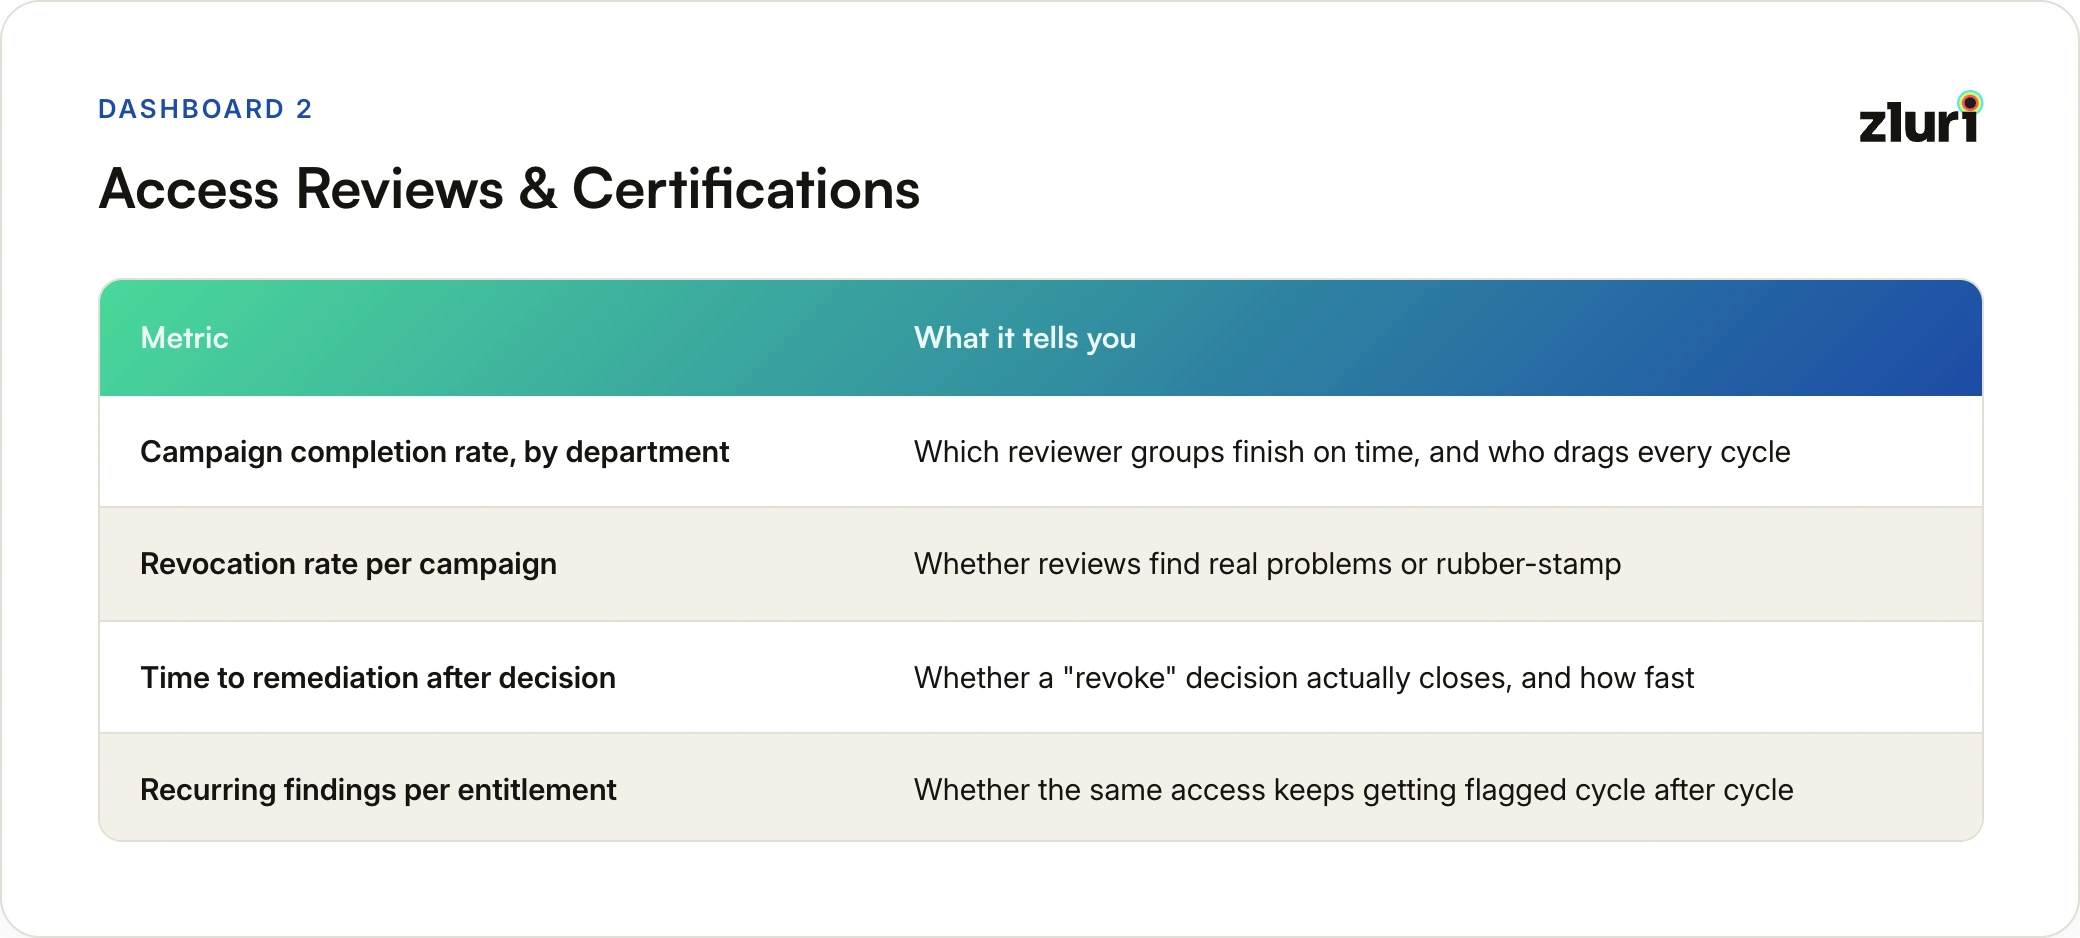
Campaign completion by department shows which reviewer groups reliably finish; revocation rate per campaign separates reviews that find real problems from rubber stamps; time-to-remediation shows whether decisions actually close and how fast; and recurring findings per entitlement expose the upstream provisioning rules that keep regenerating the same problem. That last one is the difference between reviews as cleanup and reviews as feedback.
Dashboard 3: Entitlement & Account Hygiene
The standing-state view: what's accumulating in the environment independent of any campaign or workflow.
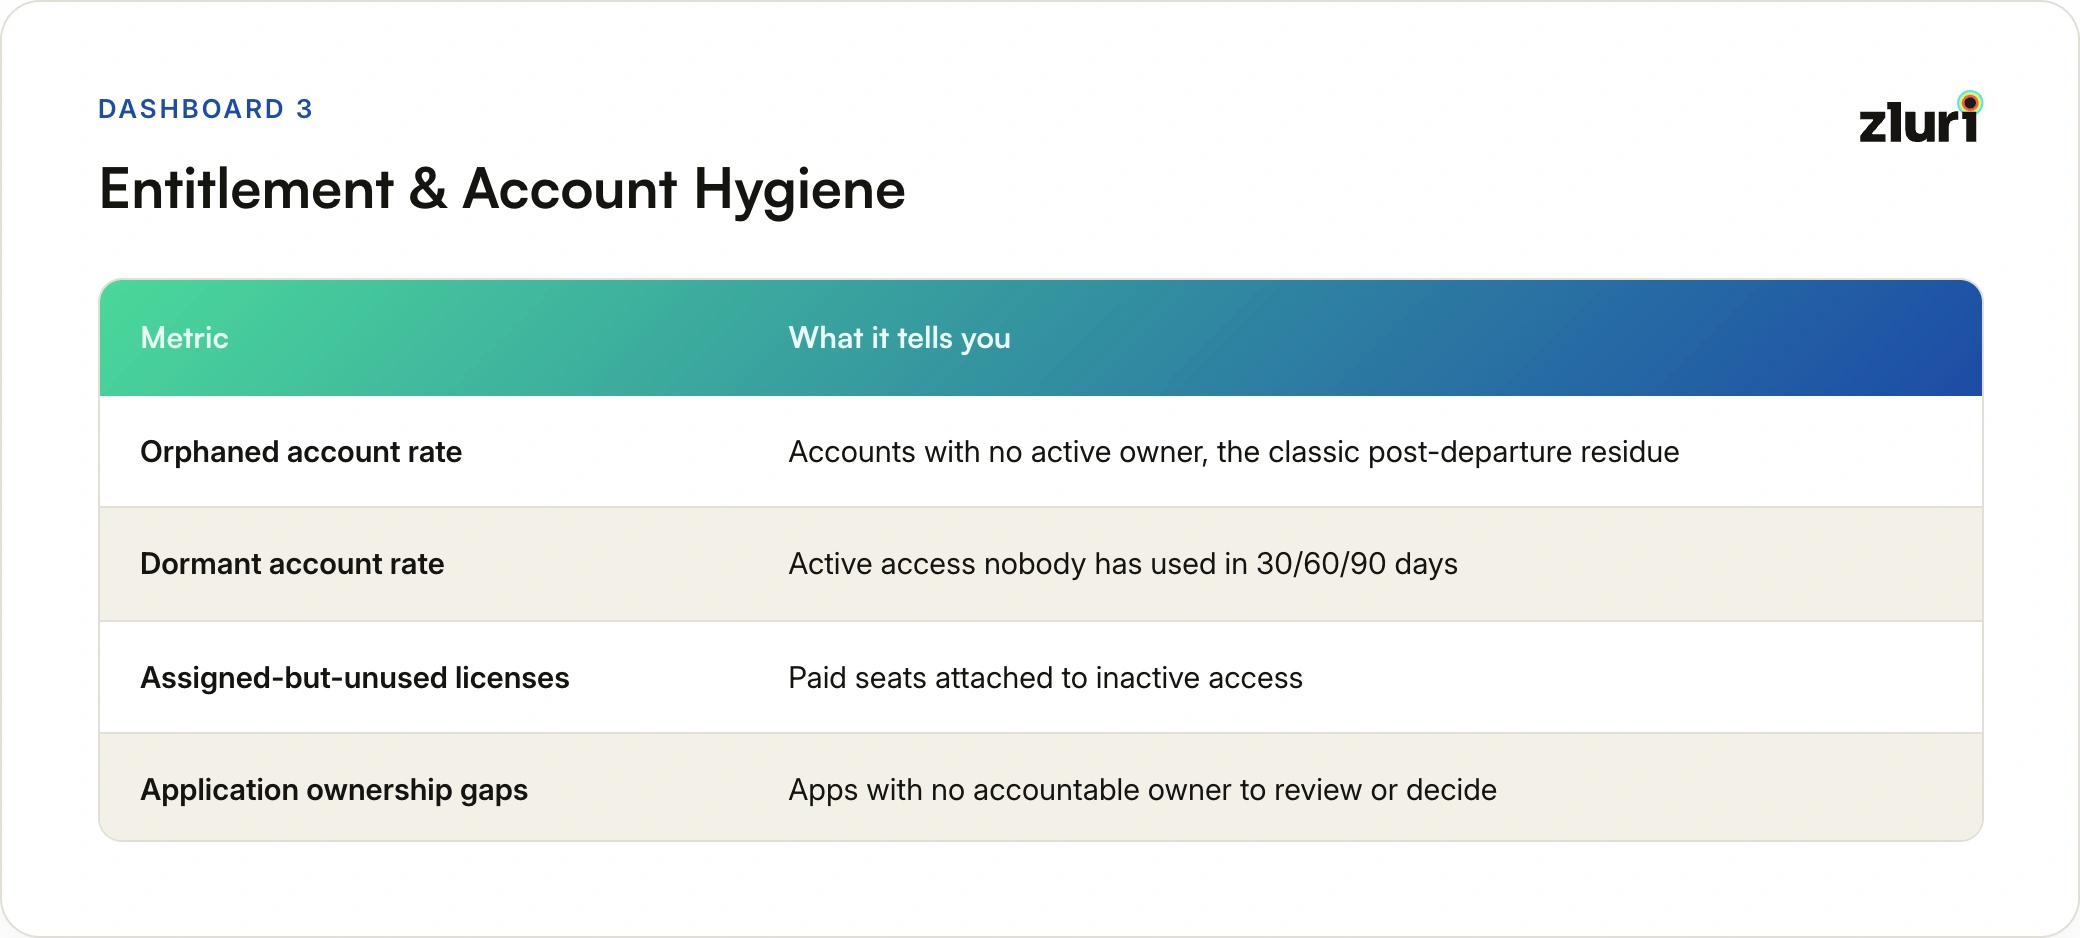
This dashboard runs continuously against the discovered estate, tracking orphaned accounts, dormant access nobody has used in 30, 60, or 90 days, licenses assigned but sitting unused, and applications with no accountable owner. Hygiene is the one dashboard whose numbers aren't produced by anything the program does; they're the standing state of access at any given moment, whether or not anyone scheduled a review of it.
Dashboard 4: Lifecycle Automation
The workflow view: whether joiner, mover, and leaver events execute completely, and how fast.
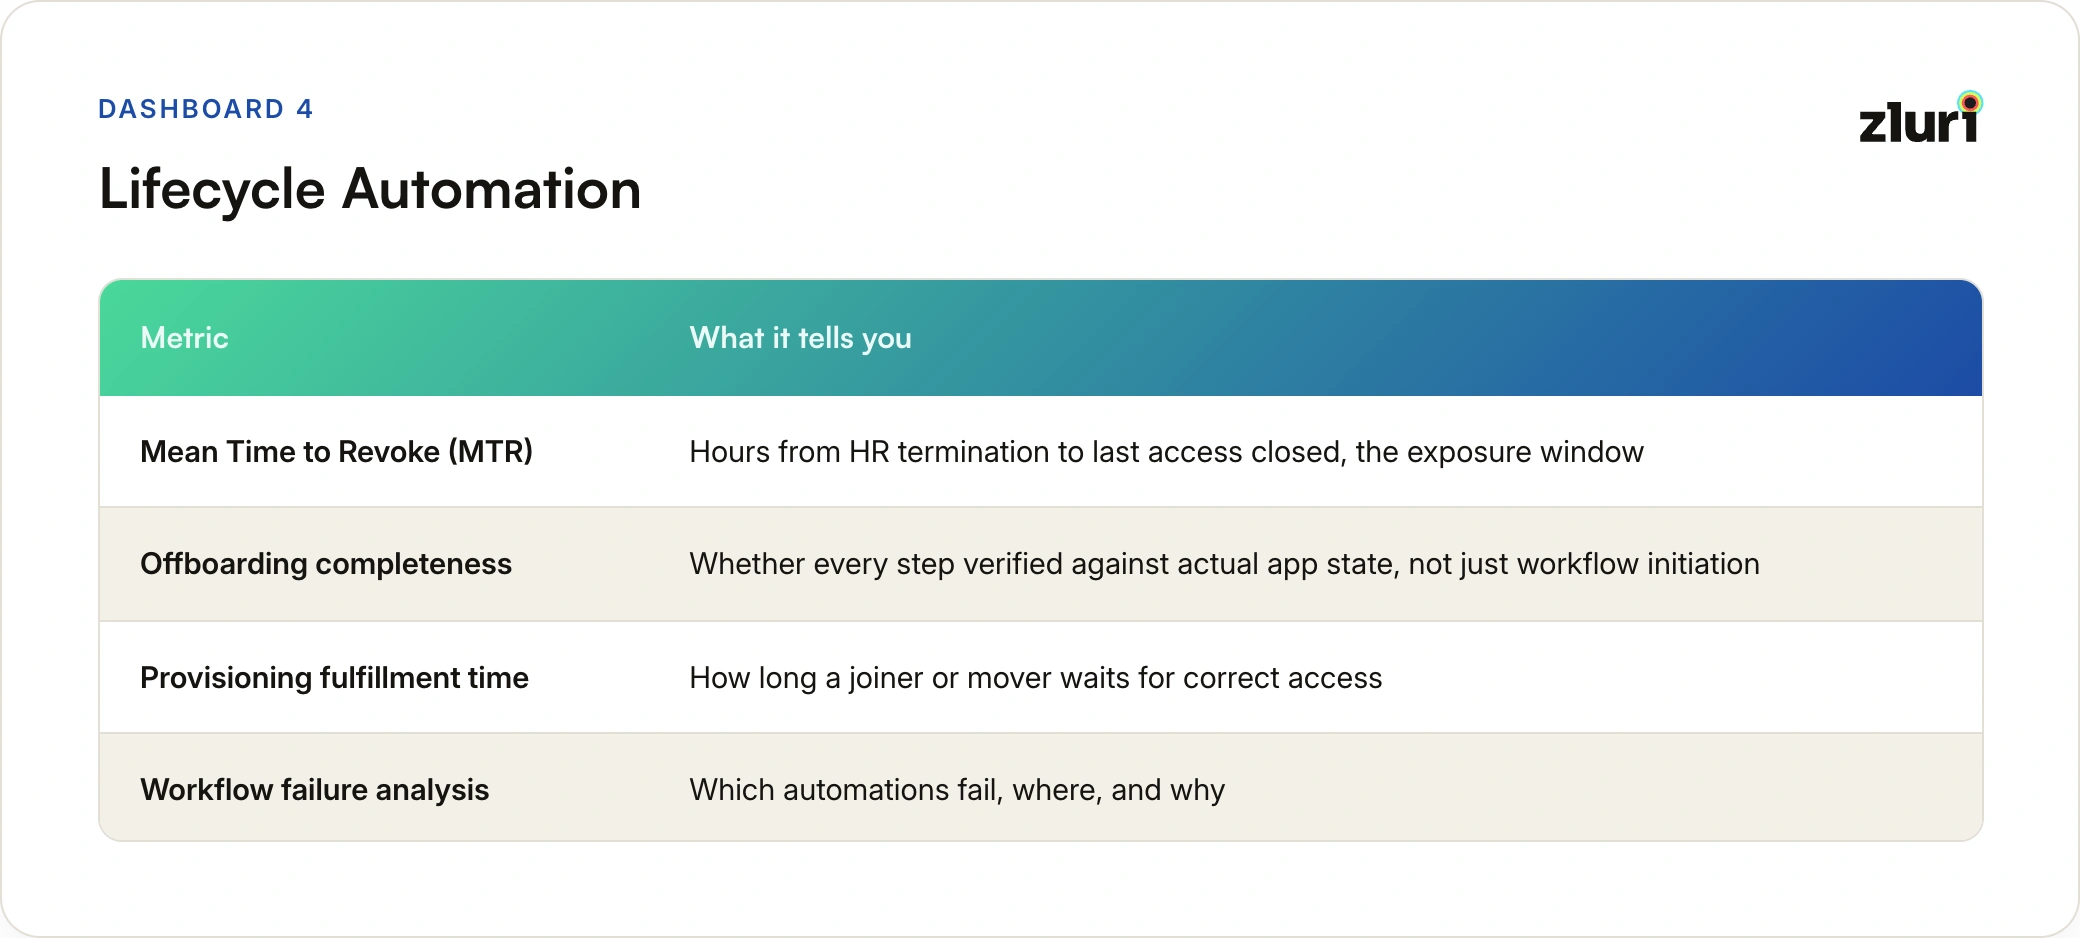
MTR connects the HRIS termination event to completed deprovisioning in every target app, which is the single most important exposure number in identity governance. Offboarding completeness verifies each workflow step against actual per-app account state, the difference between "the workflow ran" and "the access is gone," including apps outside SSO that discovery surfaced. Provisioning fulfillment time covers the joiner and mover side, and workflow failure analysis shows which automations silently break, so a failed sync becomes a flagged item rather than a bad review three months later.
Dashboard 5: Application Governance
The per-app view: whether every application in the inventory is actually governed, not just listed.
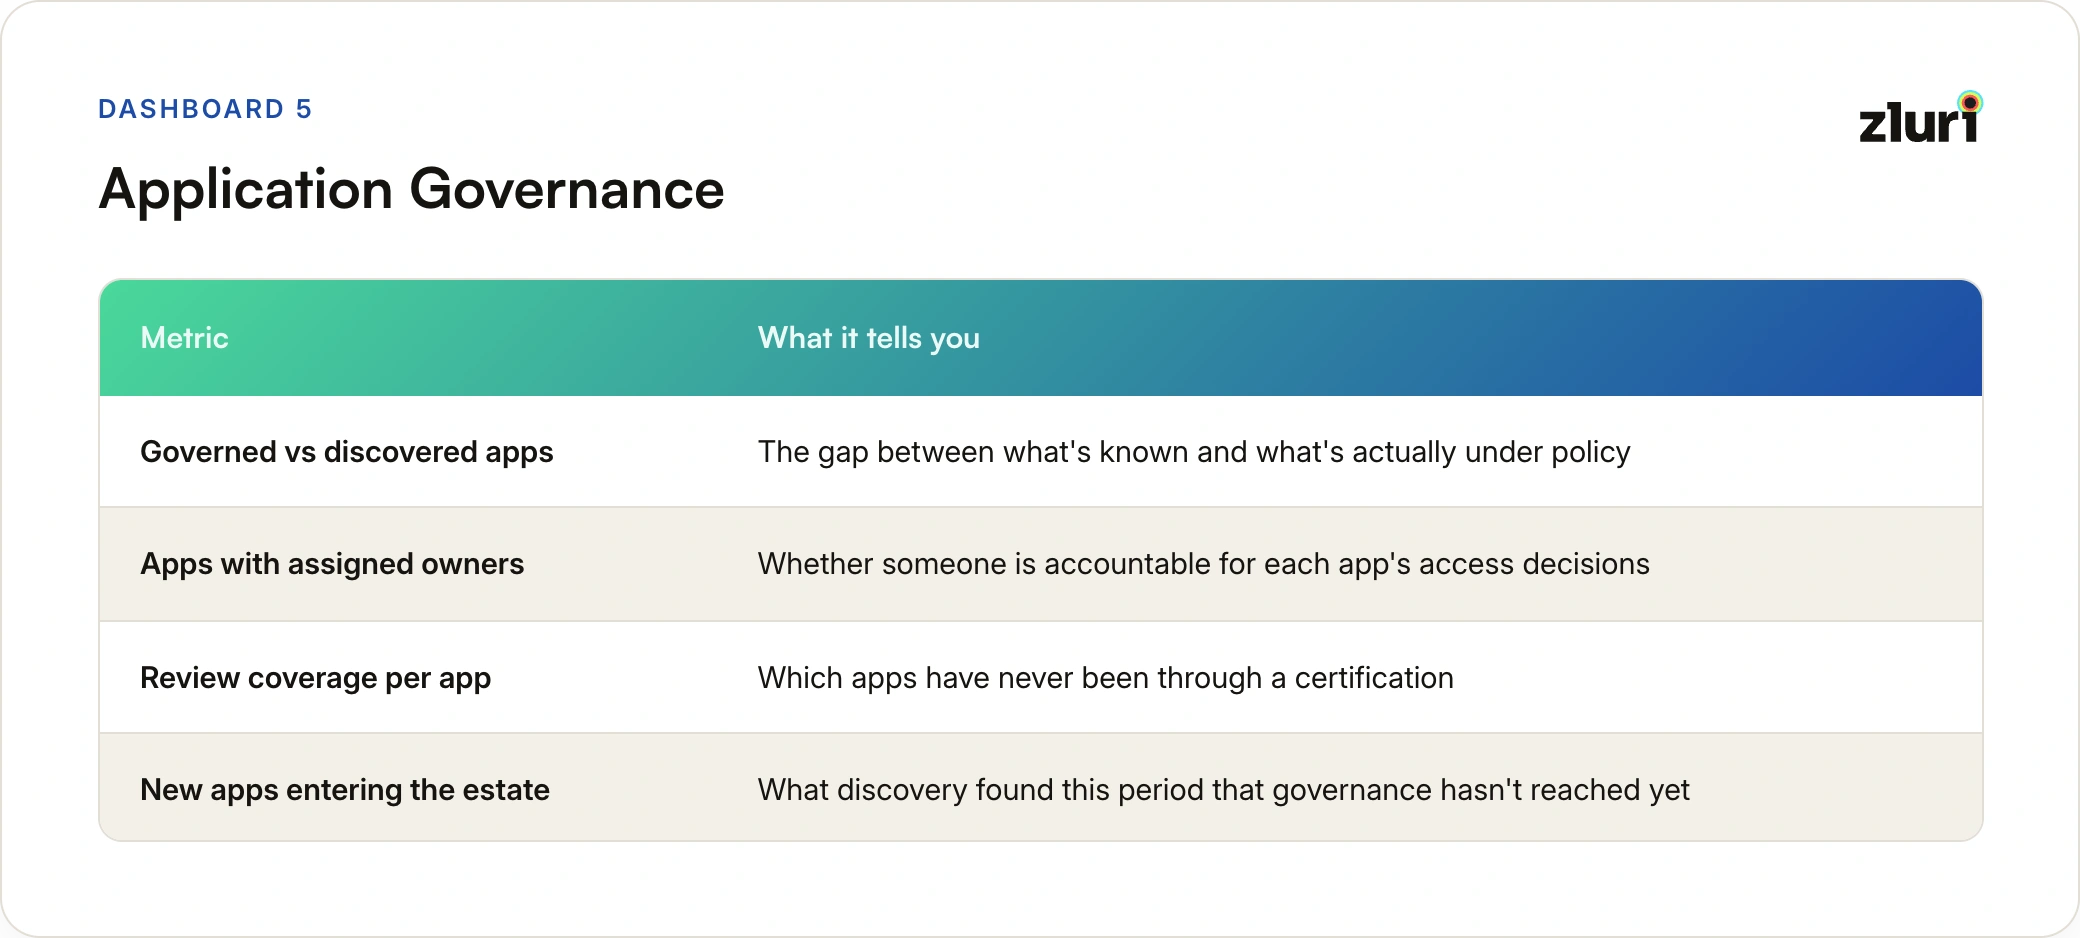
This dashboard tracks the gap between discovered and governed applications, ownership assignment across the portfolio, which apps have never been through a review, and what new applications discovery surfaced that governance hasn't yet reached. It's the coverage dashboard: the one that answers whether governance scope is keeping pace with the estate as it grows.
Dashboard 6: Audit & Compliance
The evidence view: whether everything above can be proven to someone outside the team.
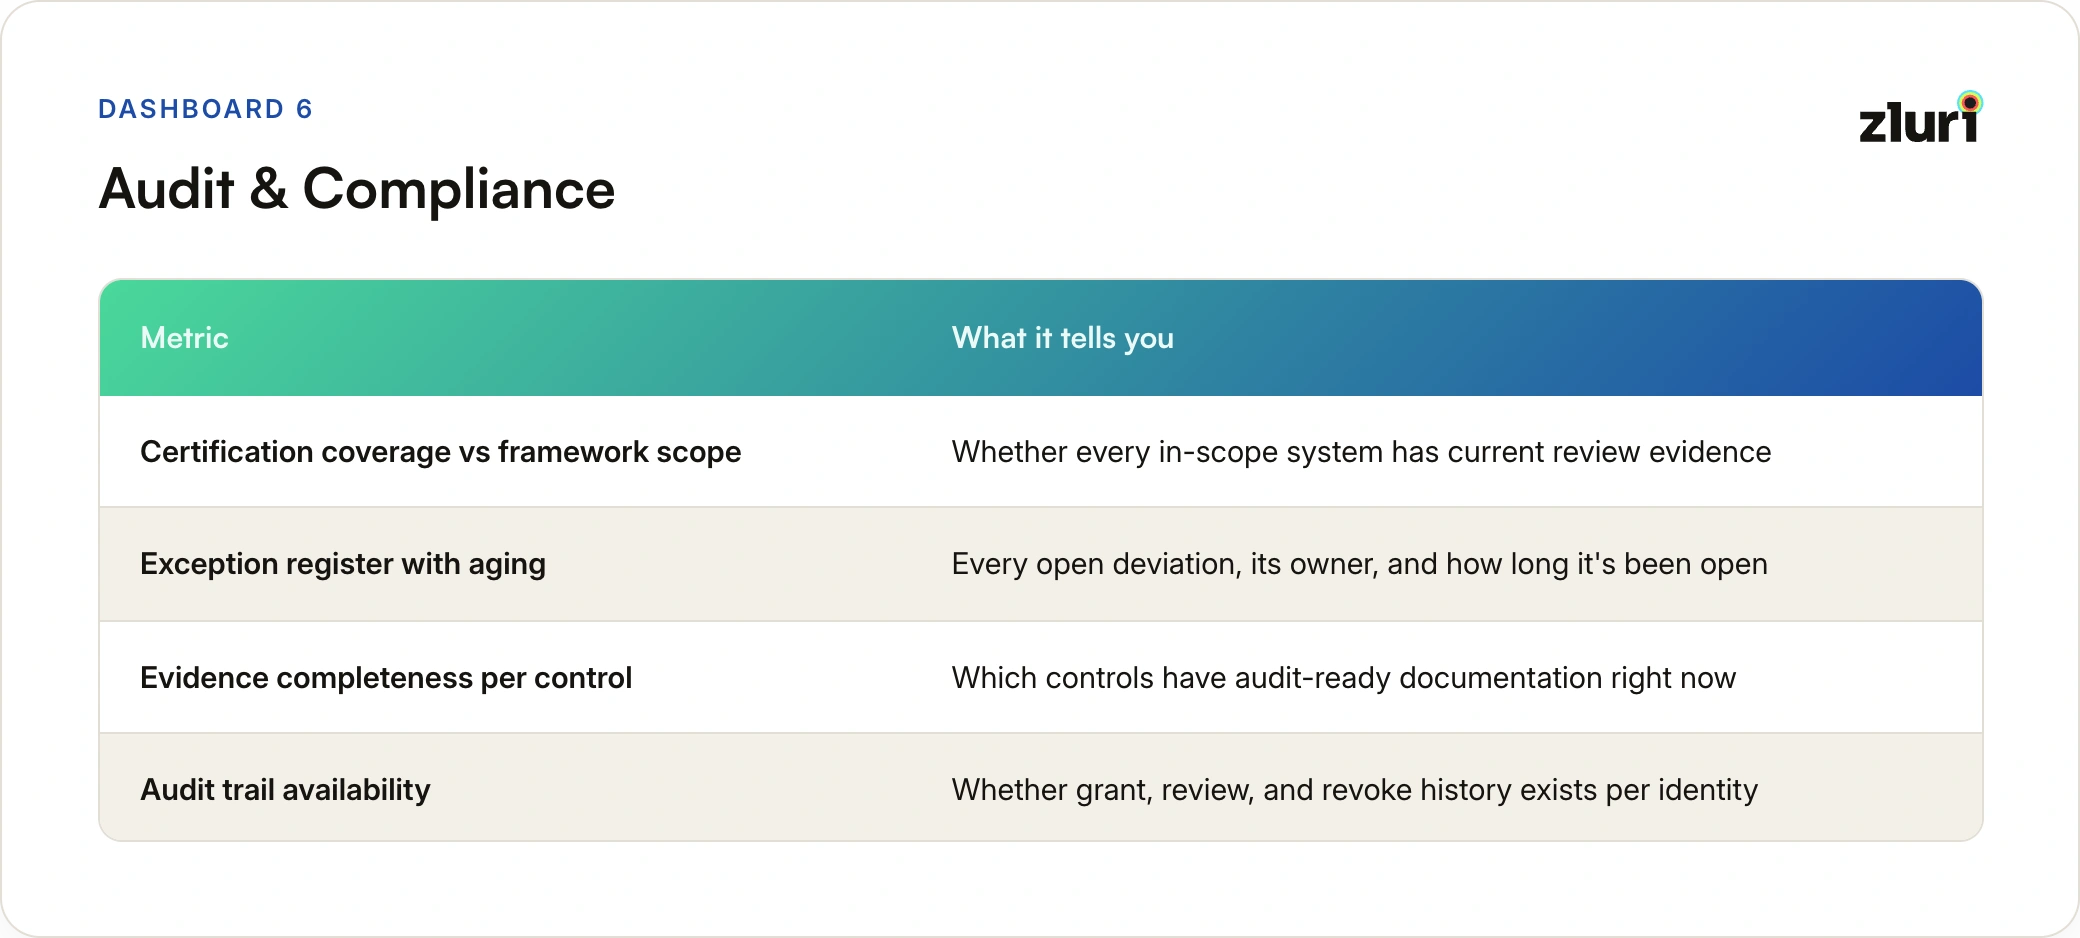
Certification coverage shows whether every system in a framework's scope carries current review evidence; the exception register tracks every open deviation with an owner and an age, which is the register auditors have learned to ask for; evidence completeness shows which controls are documented audit-ready today, not after a preparation sprint; and the audit trail confirms the grant-review-revoke history exists per identity. This dashboard exists so audit prep is a report, not a project.
How the Dashboards Work
Three things about the mechanics matter more than any individual metric:
- They read live data. Every number computes from the platform's operational state: account status, workflow outcomes, request queues, review decisions. There's no export step, no ETL pipeline, no BI project to maintain, and nothing to fall out of date.
- They filter along the dimensions teams actually use. Department, application, identity type (human vs non-human), risk level, time period, the same number can be cut for an IAM engineer investigating one app or a CISO reporting a quarter's trend.
- Every number traces to its records. A spiked MTR drills down to the specific departures and the specific apps where deprovisioning lagged. When a metric surprises you, the evidence behind it is one click deep, not a reconciliation project away.
What Teams Actually Do With It
The dashboards change behavior in three recognizable ways:
- Audit prep becomes a standing state. Compliance owners watch the exception register and evidence completeness between audits instead of discovering both during one. The how to measure IGA guide covers what healthy looks like for each metric; the dashboard is where you check yours against it.
- Operations gets a remediation queue, not a report. Orphaned accounts, failed workflows, and unowned apps surface as items to act on, with the context to act attached, rather than rows in a quarterly export someone has to triage.
- Leadership reporting stops being an assembly job. The same trend lines, automation coverage, governance scope, certification coverage, computed the same way every quarter, at the altitude a board can absorb. Which numbers belong in which conversation is its own discipline, covered in the five levers of governance value.
Frequently Asked Questions
Do the dashboards require setup or data pipeline work?
No. The metrics compute from the platform's own operational data, discovery, lifecycle workflows, requests, and reviews all write to the same data layer, so Governance Intelligence reads what already exists. There's no export, ETL, or BI project to build or maintain.
How current are the numbers?
Continuously current for operational and hygiene metrics, since they read live platform state: account status, workflow outcomes, request queues. Trend metrics like certification coverage and governance scope accumulate over cycles, which is exactly what makes them meaningful at leadership cadence.
Do the dashboards cover non-human identities too?
Yes. Service accounts, API keys, and other non-human identities appear in the same views: the Access Governance dashboard counts them in the governed population, hygiene metrics catch dormant and orphaned NHIs the same way they catch human ones, and the audit trail covers their grant and revoke history identically.
Can different stakeholders use different dashboards?
That's the design. An IAM engineer lives in Lifecycle Automation and Hygiene, a compliance owner in Audit & Compliance, security leadership in Access Governance, and the filters cut each view further by department, app, or risk level, so nobody re-cuts numbers by hand for their audience.
What happens when a metric looks wrong?
Every number traces to its underlying records: a spiked MTR drills down to the specific departures and apps where deprovisioning lagged, a low completion rate drills to the reviewers holding it up. That traceability is the practical difference between a dashboard built on the operating data itself and one assembled from exports.