.png)



Most identity governance programs can produce activity reports: campaigns launched, requests processed, workflows triggered. Almost none can answer the question that actually matters: is any of this working? This guide covers the metrics that measure governance as an outcome, what healthy looks like for each, and where to find them.
Ask an IGA program owner how the program is doing, and you'll usually get activity numbers. We ran four certification campaigns this year. We processed 2,300 access requests. We automated offboarding.
None of those numbers answers the real question. Campaigns can run and change nothing. Requests can be processed slowly enough to create risk on both ends, people waiting for access they need, and people keeping access they shouldn't have. Offboarding workflows can trigger and silently fail.
Activity tells you the program exists. Metrics tell you whether it works. The difference matters because identity governance is increasingly a board-level and audit-level conversation, and "we ran the campaigns" doesn't survive either audience. What follows is a practical framework: fourteen metrics across five dimensions, what each one measures, and what healthy looks like.
Why Most Programs Can't Measure Themselves
Before the metrics, it's worth naming why this gap exists. Most identity tooling was built to execute governance, not to measure it. A certification tool records that a review happened. A provisioning tool records that a workflow started.
What neither typically records, in a form you can report on, is the outcome:
- Did the revocation actually complete in the target app?
- How long did the whole chain take, from HR event to closed access?
- Is the same entitlement getting revoked again next quarter?
Measuring governance requires connecting data across the whole chain, which is why the ability to measure is itself a signal about how a governance stack is put together, whether it's built on a converged model or a fragmented one. That argument gets its own treatment in the measurement problem with disparate stacks; this article focuses on what to measure once you can.
The Five Dimensions of IGA Measurement
A useful mental model: governance metrics answer five different questions.
- Speed — how long does governance actually take?
- Reliability — did the workflow that ran actually complete?
- Coverage — how much of the estate is under governance at all?
- Hygiene — what does access look like right now, independent of any campaign?
- Quality — is governance actually improving anything over time?
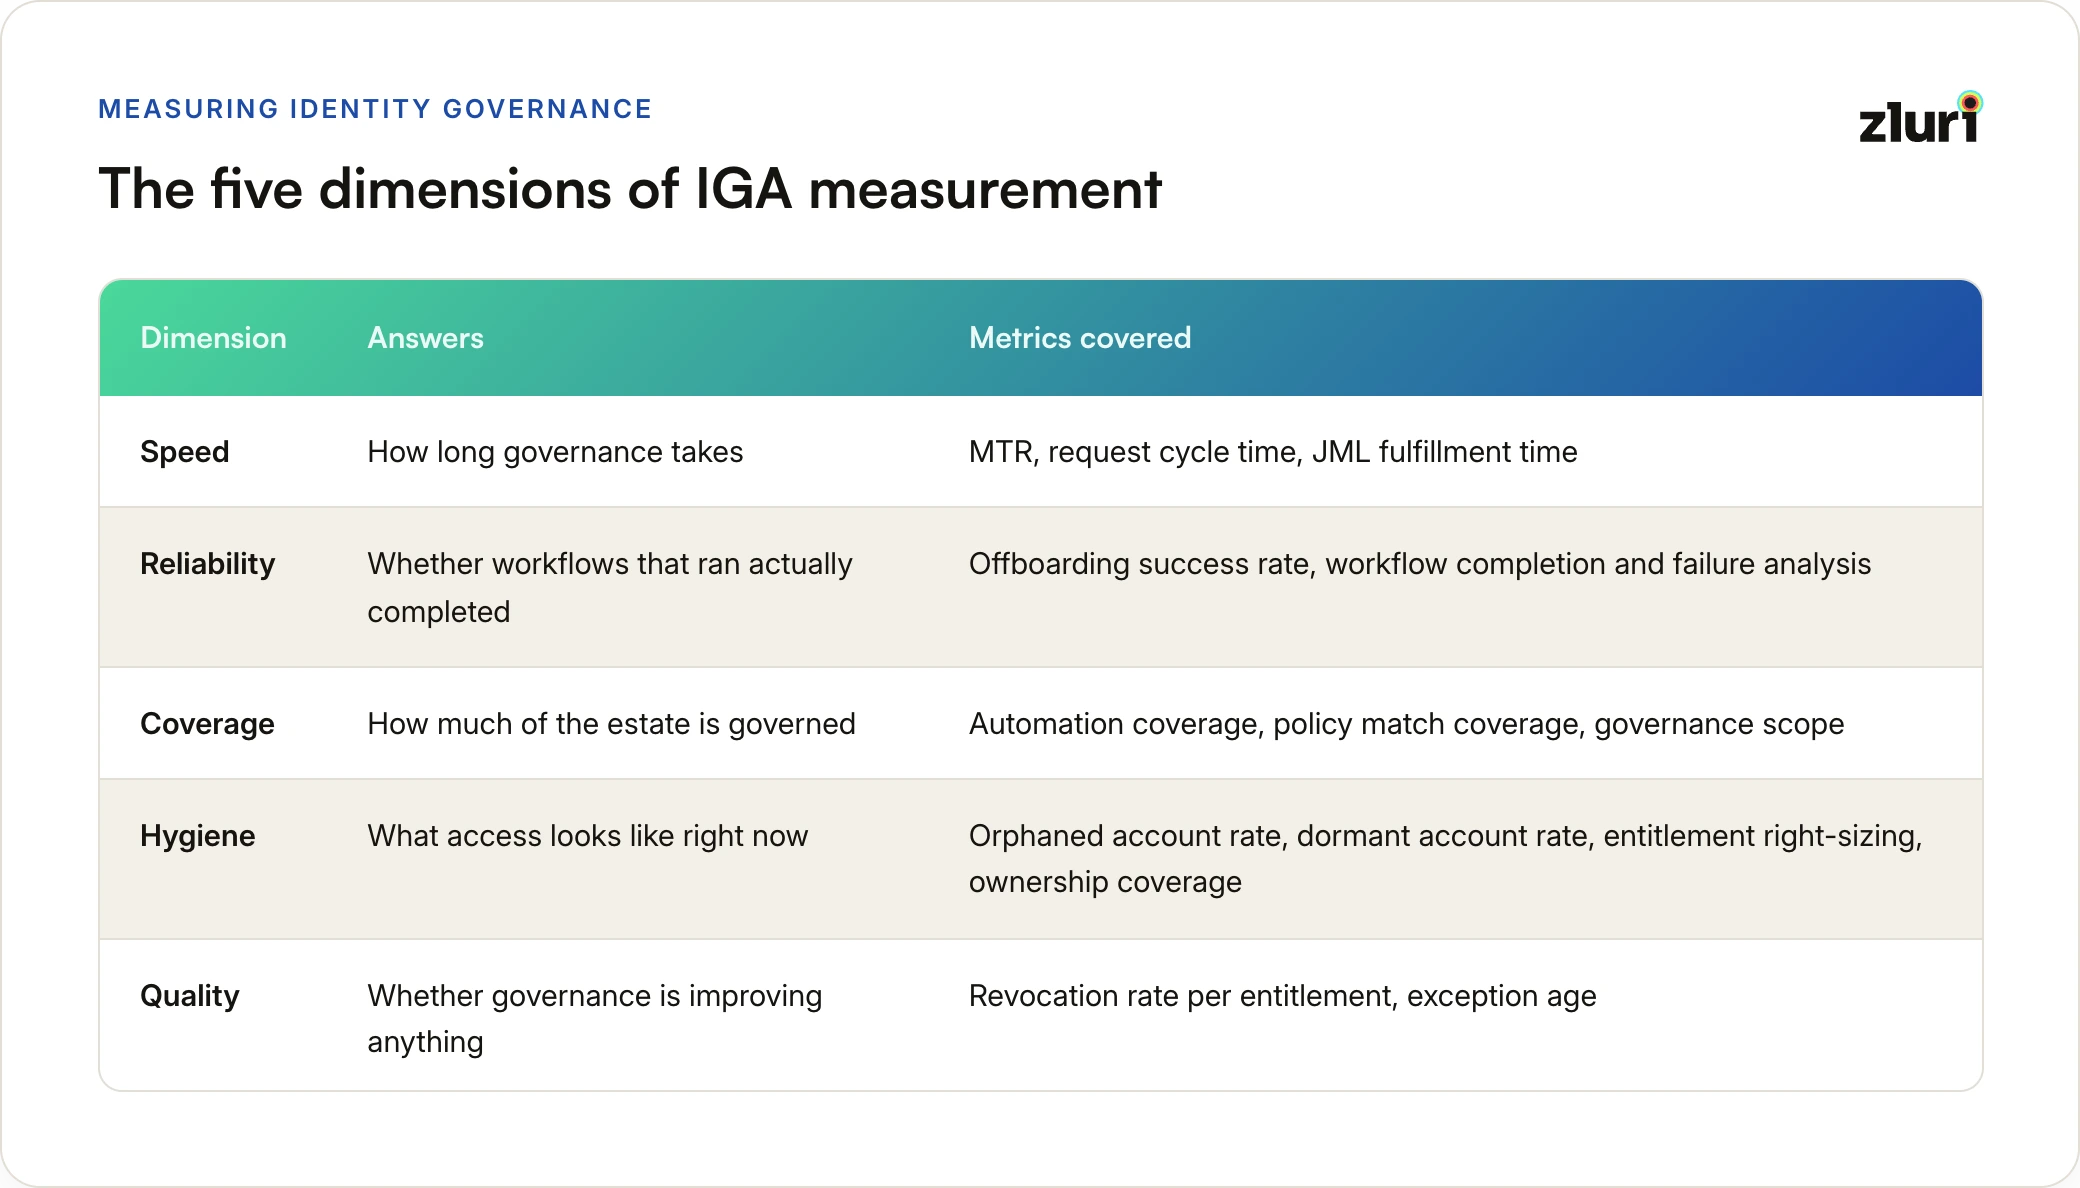
Speed without reliability is dangerous: fast workflows that silently fail are worse than slow ones you watch. Coverage without quality just means governance is touching more of the estate without getting any better at what it finds there.
Hygiene sits apart from the other four in an important way: it isn't produced by any campaign or workflow. It's the standing state of your access at any given moment, whether or not anyone has scheduled a review of it. A mature program tracks all five.
The Speed Metrics
Mean Time to Revoke (MTR). The average time between an HR termination event and completed deprovisioning across applications. This is the single most important number in identity governance, because it directly measures your exposure window: the period when someone who has left the company still holds working access. Security teams already think in Mean Time to Respond for incidents; MTR is the same discipline applied to identity. A program measured in hours is healthy. A program measured in days has a standing gap, and a program that cannot produce this number at all doesn't know the size of its own exposure.
Request cycle time. The average time from access request submission to a final decision. Long or wildly inconsistent cycle times usually point to approver bottlenecks or unclear policy ownership, and they create risk on both sides: business friction when access is slow, and rubber-stamping when approvers batch-clear a backlog.
End-to-end JML fulfillment time. Cycle time measured per lifecycle event type. For joiners, this is time-to-productive-access, a number your HR and IT leadership care about for entirely non-security reasons. For leavers, it converges with MTR. Measuring them separately shows whether governance is a bottleneck for the business or an enabler. For the underlying process this measures, see the guide to joiner, mover, and leaver workflows.
The Reliability Metrics
Offboarding success rate. The percentage of offboarding workflows that complete successfully, every step, every app. This is the flagship reliability number because offboarding is where governance failures become invisible until an audit or an incident finds them. An initiated workflow is not a completed one: a connector times out, an app's API rejects a call, a manual step sits unassigned, and the result is a departed employee with three live accounts nobody is watching. Programs that track initiation instead of completion systematically overestimate their own hygiene, which is how orphaned accounts accumulate under a dashboard that looks green.
Workflow completion rate and failure analysis. The same discipline applied to all governance workflows, not just offboarding, plus the follow-up question: when workflows fail, why? A stable failure pattern (one connector, one app, one step) is a fixable engineering problem. Rising, scattered failures are a reliability problem in the automation layer itself. Either way, you can only fix what you can see failing.
If the tool can show you initiated workflows but not failed ones, treat every reliability claim it makes as unverified.
The Coverage Metrics
Automation coverage. The percentage of joiner, mover, and leaver events handled by automation versus manual intervention. This is the clearest maturity-trajectory metric a program has: it should climb steadily as policies get codified, and each point of increase represents manual work eliminated and human error removed from a repeated process.
Policy match coverage. The percentage of access requests decided by defined rules rather than one-off human judgment. Early-stage programs decide almost everything manually. As approver logic gets written into policy, the "no rule matched" share should fall. This metric captures something subtle and valuable: it measures how much of your governance knowledge has been converted from tribal intuition into codified, repeatable, auditable policy.
Governance scope. The number of applications and identities under governance over time, tracked against the growth of the overall estate. SaaS estates grow continuously; if governed scope grows slower than the estate, your coverage is shrinking even while your absolute numbers rise. This is the metric that keeps a program honest about sprawl.
The Hygiene Metrics
These describe the state of access right now, independent of whether a review campaign has ever looked at it. A clean certification cycle doesn't mean clean access; it means the entitlements a reviewer happened to see were fine. Hygiene metrics catch what reviews miss because nobody scheduled them.
Orphaned account rate. The share of accounts, per application, with no active identity behind them: a departed employee's login that never got cleaned up, a shared service account nobody owns. This is the number that turns up in almost every access review finding, and tracking it directly, instead of waiting for a campaign to stumble onto it, turns a reactive discovery into a standing metric.
Dormant account rate. Entitlements bucketed by inactivity, thirty, sixty, ninety days. An account can be perfectly valid, provisioned correctly, tied to an active employee, and still be a risk if nobody has used it in three months. Dormancy is the leading indicator for over-provisioning: access granted on the assumption of need that never materialized.
Entitlement right-sizing (assigned-but-unused rate). The share of licenses or entitlements assigned but showing no corresponding usage. This one gets discussed almost exclusively as a cost problem, wasted software spend, when it's equally an access problem: every assigned-but-unused license is a live entitlement nobody is using, sitting there for someone to find later during an incident review, not before one.
Application ownership coverage. The share of applications with no accountable owner assigned. This is a precondition metric more than an outcome metric: an app without an owner has no one to approve its access requests sensibly, sign off on its reviews, or maintain its provisioning policy, so ownership gaps quietly explain gaps that show up everywhere else on this list.
If your last certification campaign found orphaned or dormant accounts as a surprise, that's a hygiene-metric gap, not a review-cadence gap. Reviews sample a slice on a schedule. Hygiene metrics watch the whole estate continuously.
The Quality Metrics
Revocation rate per entitlement. For each role, group, or entitlement, the percentage revoked when reviewed. Read at a point in time, this is an over-grant detector: entitlements with persistently high revocation rates are being handed out too broadly upstream, and the fix is better role design, not more reviews. Read over time, it becomes the single best indicator of whether reviews are improving anything. A mature program should see revocation rates for the same entitlements decline cycle over cycle, because upstream granting gets tighter. Flat rates across identical campaigns mean the review cycle has become checkbox compliance: finding the same problems every quarter and feeding none of it back into policy.
Exception age. Every governance program grants exceptions; that's not a failure. Untracked exceptions are the failure. This metric counts open exceptions and how long each has been open, with an owner attached. The goal is not zero exceptions but zero unowned, unaged, unexpiring ones, because an exception without a review date is just a permanent access grant with better paperwork. Auditors have learned to ask about this precisely because it's where "temporary" quietly becomes forever.
The Compliance Roll-Up
Certification coverage score. Completed versus total certifications, with on-time completion rate, per department or business unit. This is the number that travels upward: it converts campaign execution into a compliance-grade percentage a board or auditor can absorb in one glance, and per-department breakdowns show exactly where governance culture is strong and where it needs executive attention. Routing that number, and the other thirteen, to the right audience in the right frame is its own discipline, covered in five levers of value.
How to Start Measuring
Don't attempt all fourteen at once. The pragmatic sequence starts where risk concentrates:
- Exposure first. MTR and offboarding success rate, because the leaver path is where governance failure costs the most. Orphaned account rate and dormant account rate belong in this first wave too, both can usually be pulled from data you already have, and both tend to surface the single biggest existing exposure in a program before any other metric does.
- Trajectory next. Automation coverage and policy match coverage, because they show direction of travel. Entitlement right-sizing and application ownership coverage follow naturally once the estate mapping behind the orphaned and dormant numbers already exists.
- Quality once you have data to compare. Layer in the quality metrics once two or more review cycles exist to compare against each other.
The harder prerequisite is data. Every metric above requires connecting HR events, workflow execution records, per-application account state, and review decisions. If those live in one system, the metrics are a reporting exercise. If they live in four systems, the metrics are an engineering project, which is exactly why most programs never get past activity reports, and exactly the kind of gap our guide to evaluating IGA software tells you to test for before you buy. Zluri surfaces these metrics natively across its governance dashboards because requests, reviews, workflows, and account state already run through one platform; the walkthrough of Zluri's governance dashboards covers where each number lives.
Frequently Asked Questions
What is the most important IGA metric to track? Mean Time to Revoke. It directly measures the exposure window between an employee's departure and the completed removal of their access, which is the risk identity governance exists to close. If a program tracks only one number, it should be this one.
What is a good offboarding success rate? Mature, well-automated programs sustain success rates above 95 percent, with the remaining fraction visible, diagnosed, and remediated rather than silent. The more important threshold is binary: whether you can measure completion at all. A program that tracks workflow initiation but not completion has no reliable success rate, whatever its dashboard says.
How are hygiene metrics different from review-based metrics like revocation rate? Revocation rate only tells you about the fraction of access someone actually reviewed. Hygiene metrics, orphaned accounts, dormant accounts, ownership gaps, cover the entire estate continuously, not just the slice a campaign happened to sample. A program with a clean revocation rate can still be sitting on a large population of orphaned accounts nobody has scheduled a review of yet.
How is measuring IGA different from standard compliance reporting? Compliance reporting proves activities happened: campaigns ran, reviews were signed off, policies exist. IGA metrics measure whether those activities changed outcomes: access removed faster, fewer over-grants recurring, exceptions closed instead of aging. You need both, but only the second tells you the program is working.
How often should IGA metrics be reviewed? Operational metrics like MTR, workflow failures, and request cycle time deserve continuous monitoring, since each represents live risk or live friction. Hygiene metrics are similarly continuous by nature; there's no campaign to wait for. Trajectory metrics like automation coverage, revocation trends, and certification coverage fit a monthly or quarterly leadership cadence, where the question is direction rather than immediate response.
Can these metrics be tracked with a traditional IGA tool? Partially, and with effort. Traditional suites report well on activity inside their own boundary, such as campaign completion. Metrics that span systems, like MTR (HR event to per-app deprovisioning) or offboarding completeness across the full app estate, typically require exporting data from several tools into a separate BI project. Platforms where discovery, requests, reviews, and workflow execution run on one data layer can compute them natively.